These methods extract data from, and attribute new data to,
objects of class "lra", a class introduced in this package to organize
the singular value decomposition of a double-centered log-transformed data
matrix output by lra().
Usage
# S3 method for class 'lra'
as_tbl_ord(x)

# S3 method for class 'lra'
recover_rows(x)

# S3 method for class 'lra'
recover_cols(x)

# S3 method for class 'lra'
recover_inertia(x)

# S3 method for class 'lra'
recover_coord(x)

# S3 method for class 'lra'
recover_conference(x)

# S3 method for class 'lra'
recover_aug_rows(x)

# S3 method for class 'lra'
recover_aug_cols(x)

# S3 method for class 'lra'
recover_aug_coord(x)Value
The recovery generics recover_*() return core model components, distribution of inertia,
supplementary elements, and intrinsic metadata; but they require methods for each model class to
tell them what these components are.
The generic as_tbl_ord() returns its input wrapped in the 'tbl_ord'
class. Its methods determine what model classes it is allowed to wrap. It
then provides 'tbl_ord' methods with access to the recoverers and hence to
the model components.
See also
Other methods for singular value decomposition-based techniques:
methods-cancor,
methods-correspondence,
methods-lda,
methods-mca,
methods-prcomp,
methods-svd
Examples
# data frame of violent crime arrests in the United States
class(USArrests)
#> [1] "data.frame"
head(USArrests)
#>            Murder Assault UrbanPop Rape
#> Alabama      13.2     236       58 21.2
#> Alaska       10.0     263       48 44.5
#> Arizona       8.1     294       80 31.0
#> Arkansas      8.8     190       50 19.5
#> California    9.0     276       91 40.6
#> Colorado      7.9     204       78 38.7
# get state abbreviation data
state <- data.frame(
  name = state.name,
  abb = state.abb
)

# compute (non-compositional, unweighted) log-ratio analysis
USArrests %>%
  subset(select = -UrbanPop) %>%
  lra() %>%
  as_tbl_ord() %>%
  print() -> arrests_lra
#> # A tbl_ord of class 'lra': (50 × 2) · (3 × 2)´
#> # 2 coordinates: LRSV1 and LRSV2
#> # Rows (standard, 0%): [ 50 × 2 | 0 ]
#>    LRSV1  LRSV2 |
#>      [1]    [1] |
#> 1 -0.680  0.930 |
#> 2  0.930 -0.625 |
#> 3 -0.330 -1.31  |
#> 4 -0.351  0.277 |
#> 5  0.552 -1.00  |
#>        ⋮
#> # Columns (standard, 0%): [ 3 × 2 | 0 ]
#>    LRSV1  LRSV2 |
#>      [1]    [1] |
#> 1  0.283  4.96  |
#> 2 -0.371 -0.181 |
#> 3  2.88  -0.366 |

# augment log-ratio profiles with names and join state abbreviations
arrests_lra %>%
  augment_ord() %>%
  left_join_rows(state, by = "name") %>%
  print() -> arrests_lra
#> # A tbl_ord of class 'lra': (50 × 2) · (3 × 2)´
#> # 2 coordinates: LRSV1 and LRSV2
#> # Rows (standard, 0%): [ 50 × 2 | 4 ]
#>    LRSV1  LRSV2 | name       weight .element abb
#>      [1]    [1] | <chr>       <dbl> <chr>    <chr>
#> 1 -0.680  0.930 | Alabama    0.0271 active   AL
#> 2  0.930 -0.625 | Alaska     0.0318 active   AK
#> 3 -0.330 -1.31  | Arizona    0.0333 active   AZ
#> 4 -0.351  0.277 | Arkansas   0.0219 active   AR
#> 5  0.552 -1.00  | California 0.0326 active   CA
#>        ⋮                         ⋮
#> # Columns (standard, 0%): [ 3 × 2 | 3 ]
#>    LRSV1  LRSV2 | name    weight .element
#>      [1]    [1] | <chr>    <dbl> <chr>
#> 1  0.283  4.96  | Murder  0.0390 active
#> 2 -0.371 -0.181 | Assault 0.855  active
#> 3  2.88  -0.366 | Rape    0.106  active

# recover state and arrest profiles
head(get_rows(arrests_lra))
#>                 LRSV1      LRSV2
#> Alabama    -0.6800120  0.9296011
#> Alaska      0.9299899 -0.6245772
#> Arizona    -0.3298496 -1.3115817
#> Arkansas   -0.3513443  0.2773231
#> California  0.5516590 -1.0042801
#> Colorado    1.2291066 -0.6388469
get_cols(arrests_lra)
#>             LRSV1      LRSV2
#> Murder   0.283086  4.9570302
#> Assault -0.370595 -0.1805698
#> Rape     2.876702 -0.3660163
# initially, inertia is conferred on neither factor
get_conference(arrests_lra)
#> [1] 0 0

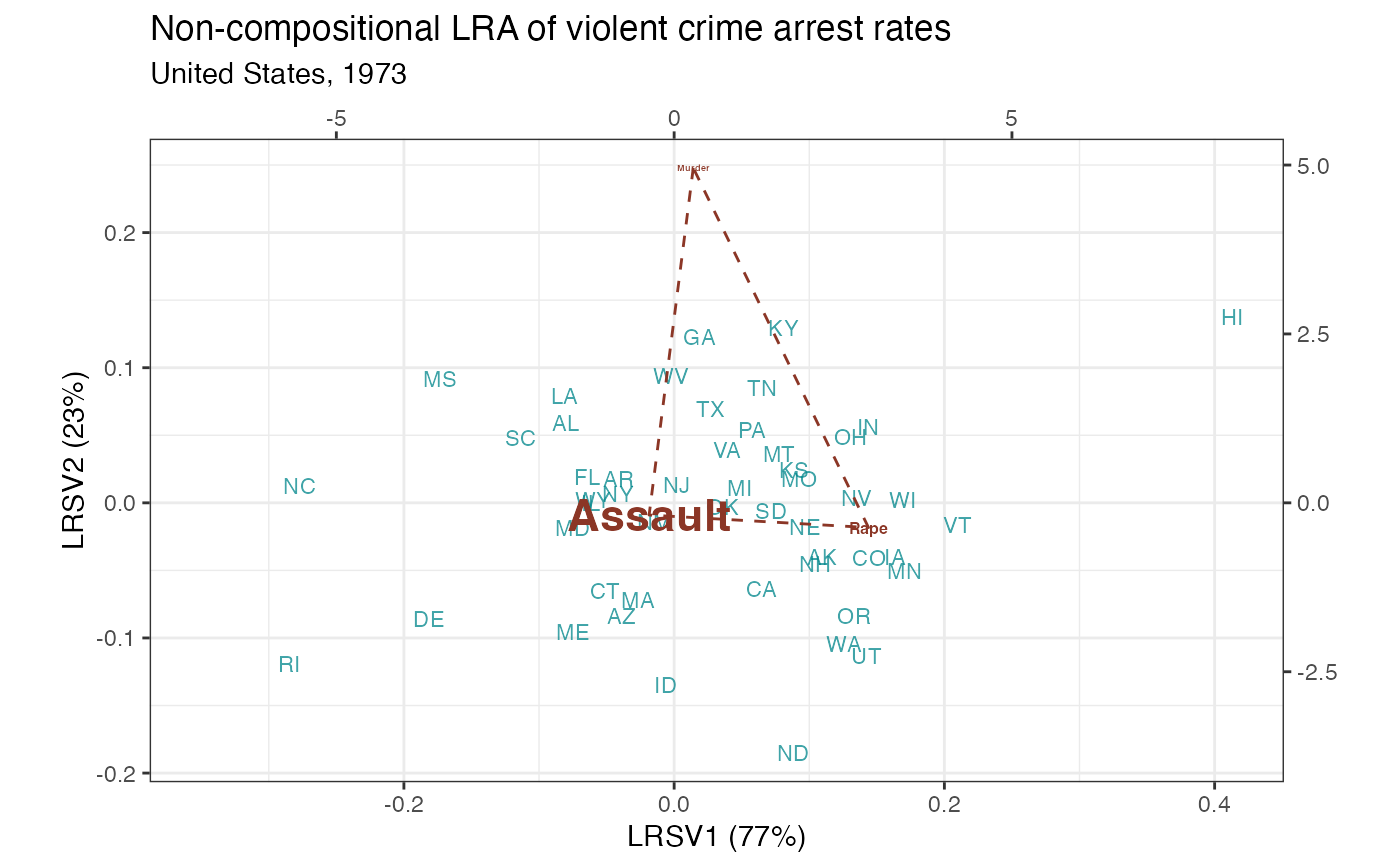
# row-principal biplot
arrests_lra %>%
  confer_inertia("rows") %>%
  ggbiplot(aes(color = .matrix), sec.axes = "cols", scale.factor = 1/20) +
  scale_color_manual(values = c("tomato4", "turquoise4")) +
  theme_bw() + theme_biplot() +
  geom_rows_text(aes(label = abb), size = 3, alpha = .75) +
  geom_cols_polygon(fill = NA, linetype = "dashed") +
  geom_cols_text(aes(label = name, size = weight), fontface = "bold") +
  scale_size_area(guide = "none") +
  ggtitle(
    "Violent crime arrest rates",
    "Non-compositional LRA"
  ) +
  coord_scaffold() +
  guides(color = "none")