These geometric element layers (geoms) pair
conventional ggplot2 geoms with stat_rows() or
stat_cols() in order to render elements for one or the other
matrix factor of a tbl_ord. They understand the same aesthetics
as their corresponding conventional geoms.
Usage
geom_rows_point(
  mapping = NULL,
  data = NULL,
  stat = "identity",
  position = "identity",
  ...,
  na.rm = FALSE,
  show.legend = NA,
  inherit.aes = TRUE
)

geom_cols_point(
  mapping = NULL,
  data = NULL,
  stat = "identity",
  position = "identity",
  ...,
  na.rm = FALSE,
  show.legend = NA,
  inherit.aes = TRUE
)

geom_rows_path(
  mapping = NULL,
  data = NULL,
  stat = "identity",
  position = "identity",
  ...,
  lineend = "butt",
  linejoin = "round",
  linemitre = 10,
  arrow = NULL,
  na.rm = FALSE,
  show.legend = NA,
  inherit.aes = TRUE
)

geom_cols_path(
  mapping = NULL,
  data = NULL,
  stat = "identity",
  position = "identity",
  ...,
  lineend = "butt",
  linejoin = "round",
  linemitre = 10,
  arrow = NULL,
  na.rm = FALSE,
  show.legend = NA,
  inherit.aes = TRUE
)

geom_rows_polygon(
  mapping = NULL,
  data = NULL,
  stat = "identity",
  position = "identity",
  rule = "evenodd",
  ...,
  na.rm = FALSE,
  show.legend = NA,
  inherit.aes = TRUE
)

geom_cols_polygon(
  mapping = NULL,
  data = NULL,
  stat = "identity",
  position = "identity",
  rule = "evenodd",
  ...,
  na.rm = FALSE,
  show.legend = NA,
  inherit.aes = TRUE
)

geom_rows_contour(
  mapping = NULL,
  data = NULL,
  stat = "contour",
  position = "identity",
  ...,
  bins = NULL,
  binwidth = NULL,
  breaks = NULL,
  lineend = "butt",
  linejoin = "round",
  linemitre = 10,
  na.rm = FALSE,
  show.legend = NA,
  inherit.aes = TRUE
)

geom_cols_contour(
  mapping = NULL,
  data = NULL,
  stat = "contour",
  position = "identity",
  ...,
  bins = NULL,
  binwidth = NULL,
  breaks = NULL,
  lineend = "butt",
  linejoin = "round",
  linemitre = 10,
  na.rm = FALSE,
  show.legend = NA,
  inherit.aes = TRUE
)

geom_rows_density_2d(
  mapping = NULL,
  data = NULL,
  stat = "density_2d",
  position = "identity",
  ...,
  contour_var = "density",
  lineend = "butt",
  linejoin = "round",
  linemitre = 10,
  na.rm = FALSE,
  show.legend = NA,
  inherit.aes = TRUE
)

geom_cols_density_2d(
  mapping = NULL,
  data = NULL,
  stat = "density_2d",
  position = "identity",
  ...,
  contour_var = "density",
  lineend = "butt",
  linejoin = "round",
  linemitre = 10,
  na.rm = FALSE,
  show.legend = NA,
  inherit.aes = TRUE
)

geom_rows_density_2d_filled(
  mapping = NULL,
  data = NULL,
  stat = "density_2d_filled",
  position = "identity",
  ...,
  contour_var = "density",
  na.rm = FALSE,
  show.legend = NA,
  inherit.aes = TRUE
)

geom_cols_density_2d_filled(
  mapping = NULL,
  data = NULL,
  stat = "density_2d_filled",
  position = "identity",
  ...,
  contour_var = "density",
  na.rm = FALSE,
  show.legend = NA,
  inherit.aes = TRUE
)

geom_rows_text(
  mapping = NULL,
  data = NULL,
  stat = "identity",
  position = "identity",
  ...,
  parse = FALSE,
  nudge_x = 0,
  nudge_y = 0,
  check_overlap = FALSE,
  size.unit = "mm",
  na.rm = FALSE,
  show.legend = NA,
  inherit.aes = TRUE
)

geom_cols_text(
  mapping = NULL,
  data = NULL,
  stat = "identity",
  position = "identity",
  ...,
  parse = FALSE,
  nudge_x = 0,
  nudge_y = 0,
  check_overlap = FALSE,
  size.unit = "mm",
  na.rm = FALSE,
  show.legend = NA,
  inherit.aes = TRUE
)

geom_rows_label(
  mapping = NULL,
  data = NULL,
  stat = "identity",
  position = "identity",
  ...,
  parse = FALSE,
  nudge_x = 0,
  nudge_y = 0,
  label.padding = unit(0.25, "lines"),
  label.r = unit(0.15, "lines"),
  label.size = 0.25,
  size.unit = "mm",
  na.rm = FALSE,
  show.legend = NA,
  inherit.aes = TRUE
)

geom_cols_label(
  mapping = NULL,
  data = NULL,
  stat = "identity",
  position = "identity",
  ...,
  parse = FALSE,
  nudge_x = 0,
  nudge_y = 0,
  label.padding = unit(0.25, "lines"),
  label.r = unit(0.15, "lines"),
  label.size = 0.25,
  size.unit = "mm",
  na.rm = FALSE,
  show.legend = NA,
  inherit.aes = TRUE
)

geom_rows_text_repel(
  mapping = NULL,
  data = NULL,
  stat = "identity",
  position = "identity",
  parse = FALSE,
  ...,
  box.padding = 0.25,
  point.padding = 1e-06,
  min.segment.length = 0.5,
  arrow = NULL,
  force = 1,
  force_pull = 1,
  max.time = 0.5,
  max.iter = 10000,
  max.overlaps = getOption("ggrepel.max.overlaps", default = 10),
  nudge_x = 0,
  nudge_y = 0,
  xlim = c(NA, NA),
  ylim = c(NA, NA),
  na.rm = FALSE,
  show.legend = NA,
  direction = c("both", "y", "x"),
  seed = NA,
  verbose = FALSE,
  inherit.aes = TRUE
)

geom_cols_text_repel(
  mapping = NULL,
  data = NULL,
  stat = "identity",
  position = "identity",
  parse = FALSE,
  ...,
  box.padding = 0.25,
  point.padding = 1e-06,
  min.segment.length = 0.5,
  arrow = NULL,
  force = 1,
  force_pull = 1,
  max.time = 0.5,
  max.iter = 10000,
  max.overlaps = getOption("ggrepel.max.overlaps", default = 10),
  nudge_x = 0,
  nudge_y = 0,
  xlim = c(NA, NA),
  ylim = c(NA, NA),
  na.rm = FALSE,
  show.legend = NA,
  direction = c("both", "y", "x"),
  seed = NA,
  verbose = FALSE,
  inherit.aes = TRUE
)

geom_rows_label_repel(
  mapping = NULL,
  data = NULL,
  stat = "identity",
  position = "identity",
  parse = FALSE,
  ...,
  box.padding = 0.25,
  label.padding = 0.25,
  point.padding = 1e-06,
  label.r = 0.15,
  label.size = 0.25,
  min.segment.length = 0.5,
  arrow = NULL,
  force = 1,
  force_pull = 1,
  max.time = 0.5,
  max.iter = 10000,
  max.overlaps = getOption("ggrepel.max.overlaps", default = 10),
  nudge_x = 0,
  nudge_y = 0,
  xlim = c(NA, NA),
  ylim = c(NA, NA),
  na.rm = FALSE,
  show.legend = NA,
  direction = c("both", "y", "x"),
  seed = NA,
  verbose = FALSE,
  inherit.aes = TRUE
)

geom_cols_label_repel(
  mapping = NULL,
  data = NULL,
  stat = "identity",
  position = "identity",
  parse = FALSE,
  ...,
  box.padding = 0.25,
  label.padding = 0.25,
  point.padding = 1e-06,
  label.r = 0.15,
  label.size = 0.25,
  min.segment.length = 0.5,
  arrow = NULL,
  force = 1,
  force_pull = 1,
  max.time = 0.5,
  max.iter = 10000,
  max.overlaps = getOption("ggrepel.max.overlaps", default = 10),
  nudge_x = 0,
  nudge_y = 0,
  xlim = c(NA, NA),
  ylim = c(NA, NA),
  na.rm = FALSE,
  show.legend = NA,
  direction = c("both", "y", "x"),
  seed = NA,
  verbose = FALSE,
  inherit.aes = TRUE
)

geom_rows_axis(
  mapping = NULL,
  data = NULL,
  stat = "identity",
  position = "identity",
  axis_labels = TRUE,
  axis_ticks = TRUE,
  axis_text = TRUE,
  by = NULL,
  num = NULL,
  tick_length = 0.025,
  text_dodge = 0.03,
  label_dodge = 0.03,
  ...,
  axis.colour = NULL,
  axis.color = NULL,
  axis.alpha = NULL,
  label.angle = 0,
  label.colour = NULL,
  label.color = NULL,
  label.alpha = NULL,
  tick.linewidth = 0.25,
  tick.colour = NULL,
  tick.color = NULL,
  tick.alpha = NULL,
  text.size = 2.6,
  text.angle = 0,
  text.hjust = 0.5,
  text.vjust = 0.5,
  text.family = NULL,
  text.fontface = NULL,
  text.colour = NULL,
  text.color = NULL,
  text.alpha = NULL,
  parse = FALSE,
  check_overlap = FALSE,
  na.rm = FALSE,
  show.legend = NA,
  inherit.aes = TRUE
)

geom_cols_axis(
  mapping = NULL,
  data = NULL,
  stat = "identity",
  position = "identity",
  axis_labels = TRUE,
  axis_ticks = TRUE,
  axis_text = TRUE,
  by = NULL,
  num = NULL,
  tick_length = 0.025,
  text_dodge = 0.03,
  label_dodge = 0.03,
  ...,
  axis.colour = NULL,
  axis.color = NULL,
  axis.alpha = NULL,
  label.angle = 0,
  label.colour = NULL,
  label.color = NULL,
  label.alpha = NULL,
  tick.linewidth = 0.25,
  tick.colour = NULL,
  tick.color = NULL,
  tick.alpha = NULL,
  text.size = 2.6,
  text.angle = 0,
  text.hjust = 0.5,
  text.vjust = 0.5,
  text.family = NULL,
  text.fontface = NULL,
  text.colour = NULL,
  text.color = NULL,
  text.alpha = NULL,
  parse = FALSE,
  check_overlap = FALSE,
  na.rm = FALSE,
  show.legend = NA,
  inherit.aes = TRUE
)

geom_rows_pointranges(
  mapping = NULL,
  data = NULL,
  stat = "center",
  position = "identity",
  ...,
  na.rm = FALSE,
  show.legend = NA,
  inherit.aes = TRUE
)

geom_cols_pointranges(
  mapping = NULL,
  data = NULL,
  stat = "center",
  position = "identity",
  ...,
  na.rm = FALSE,
  show.legend = NA,
  inherit.aes = TRUE
)

geom_rows_lineranges(
  mapping = NULL,
  data = NULL,
  stat = "center",
  position = "identity",
  ...,
  na.rm = FALSE,
  show.legend = NA,
  inherit.aes = TRUE
)

geom_cols_lineranges(
  mapping = NULL,
  data = NULL,
  stat = "center",
  position = "identity",
  ...,
  na.rm = FALSE,
  show.legend = NA,
  inherit.aes = TRUE
)

geom_rows_isoline(
  mapping = NULL,
  data = NULL,
  stat = "identity",
  position = "identity",
  isoline_text = TRUE,
  by = NULL,
  num = NULL,
  text_dodge = 0.03,
  ...,
  text.size = 3,
  text.angle = 0,
  text.colour = NULL,
  text.color = NULL,
  text.alpha = NULL,
  parse = FALSE,
  check_overlap = FALSE,
  na.rm = FALSE,
  show.legend = NA,
  inherit.aes = TRUE
)

geom_cols_isoline(
  mapping = NULL,
  data = NULL,
  stat = "identity",
  position = "identity",
  isoline_text = TRUE,
  by = NULL,
  num = NULL,
  text_dodge = 0.03,
  ...,
  text.size = 3,
  text.angle = 0,
  text.colour = NULL,
  text.color = NULL,
  text.alpha = NULL,
  parse = FALSE,
  check_overlap = FALSE,
  na.rm = FALSE,
  show.legend = NA,
  inherit.aes = TRUE
)

geom_rows_text_radiate(
  mapping = NULL,
  data = NULL,
  stat = "identity",
  position = "identity",
  ...,
  parse = FALSE,
  check_overlap = FALSE,
  na.rm = FALSE,
  show.legend = NA,
  inherit.aes = TRUE
)

geom_cols_text_radiate(
  mapping = NULL,
  data = NULL,
  stat = "identity",
  position = "identity",
  ...,
  parse = FALSE,
  check_overlap = FALSE,
  na.rm = FALSE,
  show.legend = NA,
  inherit.aes = TRUE
)

geom_rows_vector(
  mapping = NULL,
  data = NULL,
  stat = "identity",
  position = "identity",
  arrow = default_arrow,
  lineend = "round",
  linejoin = "mitre",
  vector_labels = TRUE,
  ...,
  label.colour = NULL,
  label.color = NULL,
  label.alpha = NULL,
  parse = FALSE,
  check_overlap = FALSE,
  na.rm = FALSE,
  show.legend = NA,
  inherit.aes = TRUE
)

geom_cols_vector(
  mapping = NULL,
  data = NULL,
  stat = "identity",
  position = "identity",
  arrow = default_arrow,
  lineend = "round",
  linejoin = "mitre",
  vector_labels = TRUE,
  ...,
  label.colour = NULL,
  label.color = NULL,
  label.alpha = NULL,
  parse = FALSE,
  check_overlap = FALSE,
  na.rm = FALSE,
  show.legend = NA,
  inherit.aes = TRUE
)

geom_rows_bagplot(
  mapping = NULL,
  data = NULL,
  stat = "bagplot",
  position = "identity",
  ...,
  bag.linewidth = sync(),
  bag.linetype = sync(),
  bag.colour = "black",
  bag.color = NULL,
  bag.fill = sync(),
  bag.alpha = NA,
  median.shape = 21L,
  median.stroke = sync(),
  median.size = 5,
  median.colour = sync(),
  median.color = NULL,
  median.fill = "white",
  median.alpha = NA,
  fence.linewidth = 0.25,
  fence.linetype = 0L,
  fence.colour = sync(),
  fence.color = NULL,
  fence.fill = sync(),
  fence.alpha = 0.25,
  outlier.shape = sync(),
  outlier.stroke = sync(),
  outlier.size = sync(),
  outlier.colour = sync(),
  outlier.color = NULL,
  outlier.fill = NA,
  outlier.alpha = NA,
  na.rm = FALSE,
  show.legend = NA,
  inherit.aes = TRUE
)

geom_cols_bagplot(
  mapping = NULL,
  data = NULL,
  stat = "bagplot",
  position = "identity",
  ...,
  bag.linewidth = sync(),
  bag.linetype = sync(),
  bag.colour = "black",
  bag.color = NULL,
  bag.fill = sync(),
  bag.alpha = NA,
  median.shape = 21L,
  median.stroke = sync(),
  median.size = 5,
  median.colour = sync(),
  median.color = NULL,
  median.fill = "white",
  median.alpha = NA,
  fence.linewidth = 0.25,
  fence.linetype = 0L,
  fence.colour = sync(),
  fence.color = NULL,
  fence.fill = sync(),
  fence.alpha = 0.25,
  outlier.shape = sync(),
  outlier.stroke = sync(),
  outlier.size = sync(),
  outlier.colour = sync(),
  outlier.color = NULL,
  outlier.fill = NA,
  outlier.alpha = NA,
  na.rm = FALSE,
  show.legend = NA,
  inherit.aes = TRUE
)

geom_rows_rule(
  mapping = NULL,
  data = NULL,
  stat = "identity",
  position = "identity",
  axis_labels = TRUE,
  axis_ticks = TRUE,
  axis_text = TRUE,
  by = NULL,
  num = NULL,
  snap_rule = TRUE,
  tick_length = 0.025,
  text_dodge = 0.03,
  label_dodge = 0.03,
  ...,
  axis.colour = NULL,
  axis.color = NULL,
  axis.alpha = NULL,
  label.angle = 0,
  label.colour = NULL,
  label.color = NULL,
  label.alpha = NULL,
  tick.linewidth = 0.25,
  tick.colour = NULL,
  tick.color = NULL,
  tick.alpha = NULL,
  text.size = 2.6,
  text.angle = 0,
  text.hjust = 0.5,
  text.vjust = 0.5,
  text.family = NULL,
  text.fontface = NULL,
  text.colour = NULL,
  text.color = NULL,
  text.alpha = NULL,
  parse = FALSE,
  check_overlap = FALSE,
  na.rm = FALSE,
  show.legend = NA,
  inherit.aes = TRUE
)

geom_cols_rule(
  mapping = NULL,
  data = NULL,
  stat = "identity",
  position = "identity",
  axis_labels = TRUE,
  axis_ticks = TRUE,
  axis_text = TRUE,
  by = NULL,
  num = NULL,
  snap_rule = TRUE,
  tick_length = 0.025,
  text_dodge = 0.03,
  label_dodge = 0.03,
  ...,
  axis.colour = NULL,
  axis.color = NULL,
  axis.alpha = NULL,
  label.angle = 0,
  label.colour = NULL,
  label.color = NULL,
  label.alpha = NULL,
  tick.linewidth = 0.25,
  tick.colour = NULL,
  tick.color = NULL,
  tick.alpha = NULL,
  text.size = 2.6,
  text.angle = 0,
  text.hjust = 0.5,
  text.vjust = 0.5,
  text.family = NULL,
  text.fontface = NULL,
  text.colour = NULL,
  text.color = NULL,
  text.alpha = NULL,
  parse = FALSE,
  check_overlap = FALSE,
  na.rm = FALSE,
  show.legend = NA,
  inherit.aes = TRUE
)

geom_rows_interpolation(
  mapping = NULL,
  data = NULL,
  stat = "identity",
  position = "identity",
  new_data = NULL,
  type = c("centroid", "sequence"),
  arrow = default_arrow,
  ...,
  point.fill = NA,
  na.rm = FALSE,
  show.legend = NA,
  inherit.aes = TRUE
)

geom_cols_interpolation(
  mapping = NULL,
  data = NULL,
  stat = "identity",
  position = "identity",
  new_data = NULL,
  type = c("centroid", "sequence"),
  arrow = default_arrow,
  ...,
  point.fill = NA,
  na.rm = FALSE,
  show.legend = NA,
  inherit.aes = TRUE
)
Arguments
- mapping
Set of aesthetic mappings created by
aes(). If specified andinherit.aes = TRUE(the default), it is combined with the default mapping at the top level of the plot. You must supplymappingif there is no plot mapping.- data
The data to be displayed in this layer. There are three options:
If
NULL, the default, the data is inherited from the plot data as specified in the call toggplot().A
data.frame, or other object, will override the plot data. All objects will be fortified to produce a data frame. Seefortify()for which variables will be created.A
functionwill be called with a single argument, the plot data. The return value must be adata.frame, and will be used as the layer data. Afunctioncan be created from aformula(e.g.~ head(.x, 10)).- stat
The statistical transformation to use on the data for this layer. When using a
geom_*()function to construct a layer, thestatargument can be used the override the default coupling between geoms and stats. Thestatargument accepts the following:A
Statggproto subclass, for exampleStatCount.A string naming the stat. To give the stat as a string, strip the function name of the
stat_prefix. For example, to usestat_count(), give the stat as"count".For more information and other ways to specify the stat, see the layer stat documentation.
- position
A position adjustment to use on the data for this layer. This can be used in various ways, including to prevent overplotting and improving the display. The
positionargument accepts the following:The result of calling a position function, such as
position_jitter(). This method allows for passing extra arguments to the position.A string naming the position adjustment. To give the position as a string, strip the function name of the
position_prefix. For example, to useposition_jitter(), give the position as"jitter".For more information and other ways to specify the position, see the layer position documentation.
- ...
Additional arguments passed to
ggplot2::layer().- na.rm
Passed to
ggplot2::layer().- show.legend
logical. Should this layer be included in the legends?
NA, the default, includes if any aesthetics are mapped.FALSEnever includes, andTRUEalways includes. It can also be a named logical vector to finely select the aesthetics to display.- inherit.aes
If
FALSE, overrides the default aesthetics, rather than combining with them. This is most useful for helper functions that define both data and aesthetics and shouldn't inherit behaviour from the default plot specification, e.g.borders().- lineend
Line end style (round, butt, square).
- linejoin
Line join style (round, mitre, bevel).
- linemitre
Line mitre limit (number greater than 1).
- arrow
Arrow specification, as created by
grid::arrow().- rule
Either
"evenodd"or"winding". If polygons with holes are being drawn (using thesubgroupaesthetic) this argument defines how the hole coordinates are interpreted. See the examples ingrid::pathGrob()for an explanation.- bins
Number of contour bins. Overridden by
breaks.- binwidth
The width of the contour bins. Overridden by
bins.- breaks
One of:
Numeric vector to set the contour breaks
A function that takes the range of the data and binwidth as input and returns breaks as output. A function can be created from a formula (e.g. ~ fullseq(.x, .y)).
Overrides
binwidthandbins. By default, this is a vector of length ten withpretty()breaks.- contour_var
Character string identifying the variable to contour by. Can be one of
"density","ndensity", or"count". See the section on computed variables for details.- parse
If
TRUE, the labels will be parsed into expressions and displayed as described in?plotmath.- nudge_x, nudge_y
Horizontal and vertical adjustment to nudge labels by. Useful for offsetting text from points, particularly on discrete scales. Cannot be jointly specified with
position.- check_overlap
If
TRUE, text that overlaps previous text in the same layer will not be plotted.check_overlaphappens at draw time and in the order of the data. Therefore data should be arranged by the label column before callinggeom_text(). Note that this argument is not supported bygeom_label().- size.unit
How the
sizeaesthetic is interpreted: as millimetres ("mm", default), points ("pt"), centimetres ("cm"), inches ("in"), or picas ("pc").- label.padding
Amount of padding around label. Defaults to 0.25 lines.
- label.r
Radius of rounded corners. Defaults to 0.15 lines.
- label.size
Size of label border, in mm.
- box.padding
Amount of padding around bounding box, as unit or number. Defaults to 0.25. (Default unit is lines, but other units can be specified by passing
unit(x, "units")).- point.padding
Amount of padding around labeled point, as unit or number. Defaults to 0. (Default unit is lines, but other units can be specified by passing
unit(x, "units")).- min.segment.length
Skip drawing segments shorter than this, as unit or number. Defaults to 0.5. (Default unit is lines, but other units can be specified by passing
unit(x, "units")).- force
Force of repulsion between overlapping text labels. Defaults to 1.
- force_pull
Force of attraction between a text label and its corresponding data point. Defaults to 1.
- max.time
Maximum number of seconds to try to resolve overlaps. Defaults to 0.5.
- max.iter
Maximum number of iterations to try to resolve overlaps. Defaults to 10000.
- max.overlaps
Exclude text labels when they overlap too many other things. For each text label, we count how many other text labels or other data points it overlaps, and exclude the text label if it has too many overlaps. Defaults to 10.
- xlim, ylim
Limits for the x and y axes. Text labels will be constrained to these limits. By default, text labels are constrained to the entire plot area.
- direction
direction of stairs: 'vh' for vertical then horizontal, 'hv' for horizontal then vertical, or 'mid' for step half-way between adjacent x-values.
- seed
Random seed passed to
set.seed. Defaults toNA, which means thatset.seedwill not be called.- verbose
If
TRUE, some diagnostics of the repel algorithm are printed- axis_labels, axis_ticks, axis_text
Logical; whether to include labels, tick marks, and text value marks along the axes.
- by, num
Intervals between elements or number of elements; specify only one.
- tick_length
Numeric; the length of the tick marks, as a proportion of the minimum of the plot width and height.
- text_dodge
Numeric; the orthogonal distance of tick mark text from the axis, as a proportion of the minimum of the plot width and height.
- label_dodge
Numeric; the orthogonal distance of the axis label from the axis, as a proportion of the minimum of the plot width and height.
- axis.colour, axis.color, axis.alpha
Default aesthetics for axes. Set to NULL to inherit from the data's aesthetics.
- label.angle, label.colour, label.color, label.alpha
Default aesthetics for labels. Set to NULL to inherit from the data's aesthetics.
- tick.linewidth, tick.colour, tick.color, tick.alpha
Default aesthetics for tick marks. Set to NULL to inherit from the data's aesthetics.
- text.size, text.angle, text.hjust, text.vjust, text.family, text.fontface, text.colour, text.color, text.alpha
Default aesthetics for tick mark labels. Set to NULL to inherit from the data's aesthetics.
- isoline_text
Logical; whether to include text value marks along the isolines.
- vector_labels
Logical; whether to include labels radiating outward from the vectors.
- bag.linetype, bag.linewidth, bag.colour, bag.color, bag.fill, bag.alpha
Default aesthetics for bags. Set to
sync()to inherit from the data's aesthetics or toNULLto use the data's aesthetics.- median.shape, median.stroke, median.size, median.colour, median.color, median.fill, median.alpha
Default aesthetics for medians. Set to
sync()to inherit from the data's aesthetics or toNULLto use the data's aesthetics.- fence.linetype, fence.linewidth, fence.colour, fence.color, fence.fill, fence.alpha
Default aesthetics for fences. Set to
sync()to inherit from the data's aesthetics or toNULLto use the data's aesthetics.- outlier.shape, outlier.stroke, outlier.size, outlier.colour, outlier.color, outlier.fill, outlier.alpha
Default aesthetics for outliers. Set to
sync()to inherit from the data's aesthetics or toNULLto use the data's aesthetics.- snap_rule
Logical; whether to snap rule segments to grid values.
- new_data
A list (best structured as a data.frame) of row (
geom_cols_interpolation()) or column (geom_rows_interpolation()) values to interpolate.- type
Character value matched to
"centroid"or"sequence"; the type of operations used to visualize interpolation.- point.fill
Default aesthetics for markers. Set to NULL to inherit from the data's aesthetics.
Value
A ggproto layer.
See also
Other biplot layers:
biplot-stats,
stat_rows()
Examples
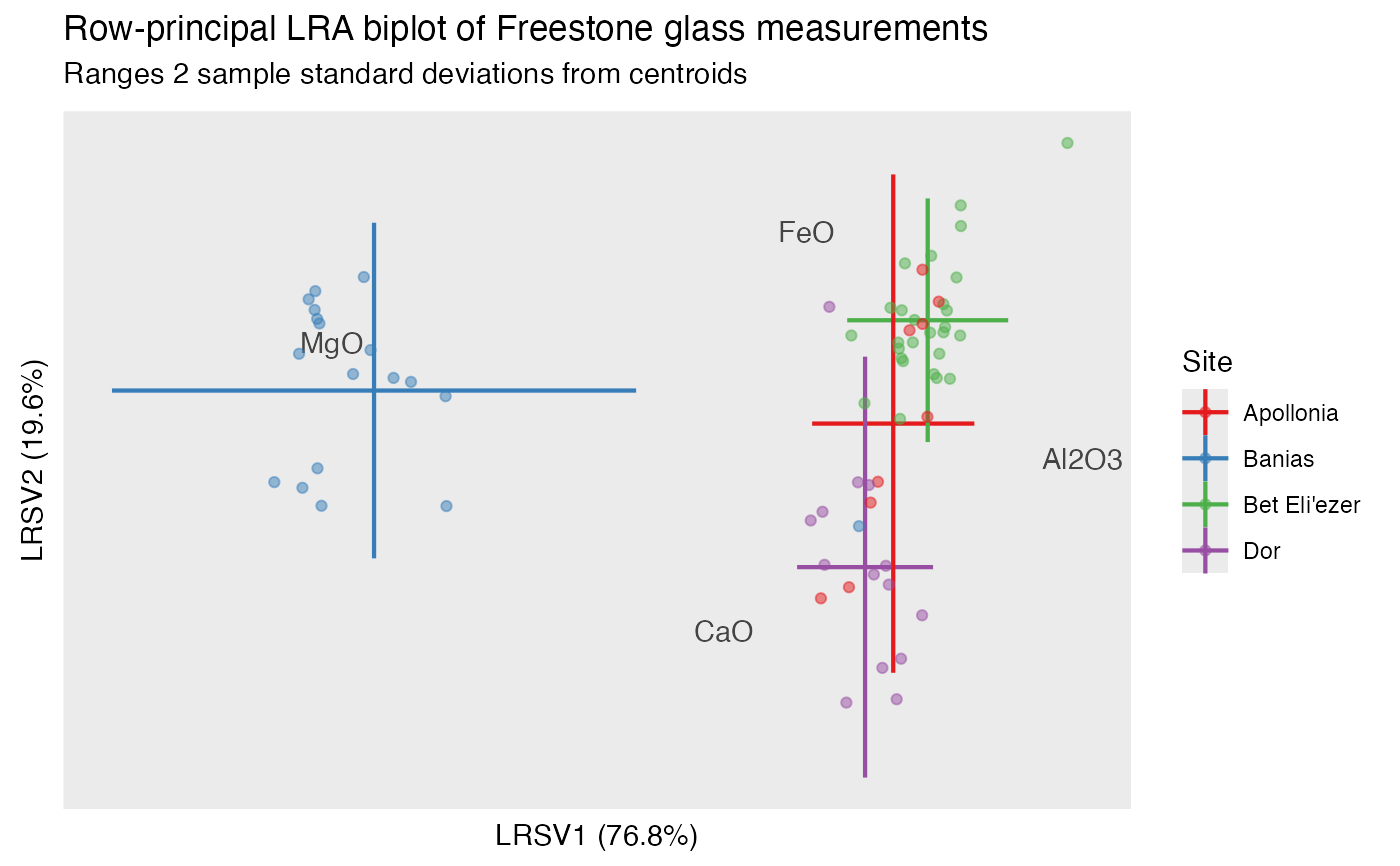
# compute log-ratio analysis of Freestone primary class composition measurements
glass %>%
ordinate(cols = c(SiO2, Al2O3, CaO, FeO, MgO),
model = lra, compositional = TRUE) %>%
confer_inertia("rows") %>%
print() -> glass_lra
#> # A tbl_ord of class 'lra': (68 x 4) x (5 x 4)'
#> # 4 coordinates: LRSV1, LRSV2, ..., LRSV4
#> #
#> # Rows (principal): [ 68 x 4 | 12 ]
#> LRSV1 LRSV2 LRSV3 ... | weight Site Anal Context Form
#> | <dbl> <chr> <chr> <chr> <chr>
#> 1 0.0925 0.0929 0.0156 | 1 0.0147 Bet El… 1 L14.B1… Chunk
#> 2 0.0905 0.0591 -0.0439 | 2 0.0147 Bet El… 2 L14.B1… Chunk
#> 3 0.0844 0.0333 -0.000492 ... | 3 0.0147 Bet El… 3 L14.B1… Chunk
#> 4 0.0647 0.0211 0.0267 | 4 0.0147 Bet El… 4 L14.B1… Chunk
#> 5 0.0635 0.0257 0.0239 | 5 0.0147 Bet El… 5 L14.B1… Chunk
#> # ℹ 63 more rows | # ℹ 63 more rows
#> # ℹ 7 more variables: TiO2 <dbl>,
#> # MnO <dbl>, Na2O <dbl>,
#> # K2O <dbl>, P2O5 <dbl>,
#> # Cl <dbl>, SO3 <dbl>
#> #
#> # Columns (standard): [ 5 x 4 | 2 ]
#> LRSV1 LRSV2 LRSV3 ... | name weight
#> | <chr> <dbl>
#> 1 -0.00548 0.338 0.237 | 1 SiO2 0.852
#> 2 4.15 -0.714 -2.50 ... | 2 Al2O3 0.0313
#> 3 -0.517 -2.95 -0.126 | 3 CaO 0.0976
#> 4 0.553 2.23 -9.57 | 4 FeO 0.00524
#> 5 -5.61 0.790 -4.47 | 5 MgO 0.0138
# row-principal biplot with ordinate-wise standard deviations
glass_lra %>%
ggbiplot(aes(color = Site), sec.axes = "cols") +
theme_biplot() +
scale_color_brewer(type = "qual", palette = 6) +
geom_cols_text(stat = "chull", aes(label = name), color = "#444444") +
geom_rows_lineranges(fun.data = mean_sdl, linewidth = .75) +
geom_rows_point(alpha = .5) +
ggtitle(
"Row-principal LRA biplot of Freestone glass measurements",
"Ranges 2 sample standard deviations from centroids"
)
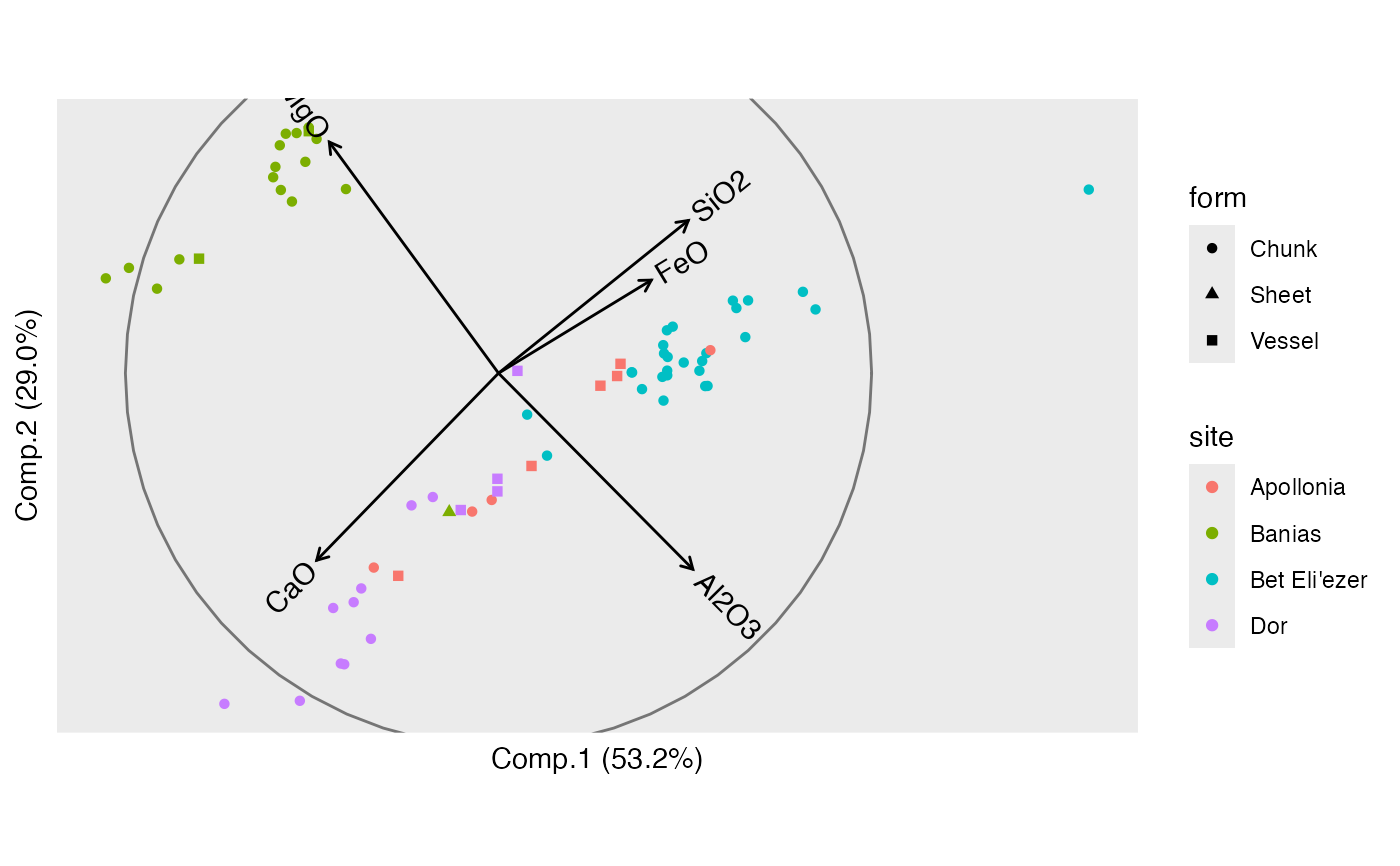
 # principal components analysis of glass composition measurements
glass[, c(5L, 7L, 8L, 10L, 11L)] %>%
princomp(cor = TRUE) %>%
as_tbl_ord() %>%
cbind_rows(site = glass$Site, form = glass$Form) %>%
augment_ord() %>%
print() -> glass_pca
#> # A tbl_ord of class 'princomp': (68 x 5) x (5 x 5)'
#> # 5 coordinates: Comp.1, Comp.2, ..., Comp.5
#> #
#> # Rows (principal): [ 68 x 5 | 3 ]
#> Comp.1 Comp.2 Comp.3 ... | .element site form
#> | <chr> <chr> <chr>
#> 1 2.01 0.585 0.940 | 1 score Bet Eli'ezer Chunk
#> 2 2.55 0.513 -1.71 | 2 score Bet Eli'ezer Chunk
#> 3 1.64 0.0977 0.131 ... | 3 score Bet Eli'ezer Chunk
#> 4 1.07 0.00734 1.20 | 4 score Bet Eli'ezer Chunk
#> 5 1.07 0.00573 1.31 | 5 score Bet Eli'ezer Chunk
#> # ℹ 63 more rows | # ℹ 63 more rows
#>
#> #
#> # Columns (standard): [ 5 x 5 | 4 ]
#> Comp.1 Comp.2 Comp.3 ... | name center scale .element
#> | <chr> <dbl> <dbl> <chr>
#> 1 0.476 0.383 0.388 | 1 SiO2 71.7 3.16 active
#> 2 0.488 -0.492 -0.0574 ... | 2 Al2O3 2.64 0.956 active
#> 3 0.383 0.234 -0.873 | 3 FeO 0.442 0.159 active
#> 4 -0.425 0.580 -0.153 | 4 MgO 1.15 0.913 active
#> 5 -0.456 -0.469 -0.247 | 5 CaO 8.18 1.36 active
# note that column standard coordinates are unit vectors
rowSums(get_cols(glass_pca) ^ 2)
#> SiO2 Al2O3 FeO MgO CaO
#> 1 1 1 1 1
# plot column standard coordinates with a unit circle underlaid
glass_pca %>%
ggbiplot(aes(label = name), sec.axes = "cols") +
theme_biplot() +
geom_rows_point(aes(color = site, shape = form), elements = "score") +
geom_unit_circle(alpha = .5, scale.factor = 3) +
geom_cols_vector()
# principal components analysis of glass composition measurements
glass[, c(5L, 7L, 8L, 10L, 11L)] %>%
princomp(cor = TRUE) %>%
as_tbl_ord() %>%
cbind_rows(site = glass$Site, form = glass$Form) %>%
augment_ord() %>%
print() -> glass_pca
#> # A tbl_ord of class 'princomp': (68 x 5) x (5 x 5)'
#> # 5 coordinates: Comp.1, Comp.2, ..., Comp.5
#> #
#> # Rows (principal): [ 68 x 5 | 3 ]
#> Comp.1 Comp.2 Comp.3 ... | .element site form
#> | <chr> <chr> <chr>
#> 1 2.01 0.585 0.940 | 1 score Bet Eli'ezer Chunk
#> 2 2.55 0.513 -1.71 | 2 score Bet Eli'ezer Chunk
#> 3 1.64 0.0977 0.131 ... | 3 score Bet Eli'ezer Chunk
#> 4 1.07 0.00734 1.20 | 4 score Bet Eli'ezer Chunk
#> 5 1.07 0.00573 1.31 | 5 score Bet Eli'ezer Chunk
#> # ℹ 63 more rows | # ℹ 63 more rows
#>
#> #
#> # Columns (standard): [ 5 x 5 | 4 ]
#> Comp.1 Comp.2 Comp.3 ... | name center scale .element
#> | <chr> <dbl> <dbl> <chr>
#> 1 0.476 0.383 0.388 | 1 SiO2 71.7 3.16 active
#> 2 0.488 -0.492 -0.0574 ... | 2 Al2O3 2.64 0.956 active
#> 3 0.383 0.234 -0.873 | 3 FeO 0.442 0.159 active
#> 4 -0.425 0.580 -0.153 | 4 MgO 1.15 0.913 active
#> 5 -0.456 -0.469 -0.247 | 5 CaO 8.18 1.36 active
# note that column standard coordinates are unit vectors
rowSums(get_cols(glass_pca) ^ 2)
#> SiO2 Al2O3 FeO MgO CaO
#> 1 1 1 1 1
# plot column standard coordinates with a unit circle underlaid
glass_pca %>%
ggbiplot(aes(label = name), sec.axes = "cols") +
theme_biplot() +
geom_rows_point(aes(color = site, shape = form), elements = "score") +
geom_unit_circle(alpha = .5, scale.factor = 3) +
geom_cols_vector()