Functionality for k-means clustering ('kmeans') objects
Source:R/methods-stats-kmeans.r
methods-kmeans.RdThese methods extract data from, and attribute new data to,
objects of class "kmeans" as returned by stats::kmeans().
Usage
# S3 method for class 'kmeans'
as_tbl_ord(x)

# S3 method for class 'kmeans'
recover_rows(x)

# S3 method for class 'kmeans'
recover_cols(x)

# S3 method for class 'kmeans'
recover_coord(x)

# S3 method for class 'kmeans'
recover_aug_rows(x)

# S3 method for class 'kmeans'
recover_aug_cols(x)

# S3 method for class 'kmeans'
recover_aug_coord(x)Value
The recovery generics recover_*() return core model components, distribution of inertia,
supplementary elements, and intrinsic metadata; but they require methods for each model class to
tell them what these components are.
The generic as_tbl_ord() returns its input wrapped in the 'tbl_ord'
class. Its methods determine what model classes it is allowed to wrap. It
then provides 'tbl_ord' methods with access to the recoverers and hence to
the model components.
See also
Other methods for idiosyncratic techniques:
methods-lm
Other models from the stats package:
methods-cancor,
methods-cmds,
methods-factanal,
methods-lm,
methods-prcomp,
methods-princomp
Examples
# data frame of Anderson iris species measurements
class(iris)
#> [1] "data.frame"
head(iris)
#>   Sepal.Length Sepal.Width Petal.Length Petal.Width Species
#> 1          5.1         3.5          1.4         0.2  setosa
#> 2          4.9         3.0          1.4         0.2  setosa
#> 3          4.7         3.2          1.3         0.2  setosa
#> 4          4.6         3.1          1.5         0.2  setosa
#> 5          5.0         3.6          1.4         0.2  setosa
#> 6          5.4         3.9          1.7         0.4  setosa
# compute 3-means clustering on scaled iris measurements
set.seed(5601L)
iris %>%
  subset(select = -Species) %>%
  scale() %>%
  kmeans(centers = 3) %>%
  print() -> iris_km
#> K-means clustering with 3 clusters of sizes 50, 53, 47
#>
#> Cluster means:
#>   Sepal.Length Sepal.Width Petal.Length Petal.Width
#> 1  -1.01119138  0.85041372   -1.3006301  -1.2507035
#> 2  -0.05005221 -0.88042696    0.3465767   0.2805873
#> 3   1.13217737  0.08812645    0.9928284   1.0141287
#>
#> Clustering vector:
#>   1   2   3   4   5   6   7   8   9  10  11  12  13  14  15  16  17  18  19  20
#>   1   1   1   1   1   1   1   1   1   1   1   1   1   1   1   1   1   1   1   1
#>  21  22  23  24  25  26  27  28  29  30  31  32  33  34  35  36  37  38  39  40
#>   1   1   1   1   1   1   1   1   1   1   1   1   1   1   1   1   1   1   1   1
#>  41  42  43  44  45  46  47  48  49  50  51  52  53  54  55  56  57  58  59  60
#>   1   1   1   1   1   1   1   1   1   1   3   3   3   2   2   2   3   2   2   2
#>  61  62  63  64  65  66  67  68  69  70  71  72  73  74  75  76  77  78  79  80
#>   2   2   2   2   2   3   2   2   2   2   3   2   2   2   2   3   3   3   2   2
#>  81  82  83  84  85  86  87  88  89  90  91  92  93  94  95  96  97  98  99 100
#>   2   2   2   2   2   3   3   2   2   2   2   2   2   2   2   2   2   2   2   2
#> 101 102 103 104 105 106 107 108 109 110 111 112 113 114 115 116 117 118 119 120
#>   3   2   3   3   3   3   2   3   3   3   3   3   3   2   2   3   3   3   3   2
#> 121 122 123 124 125 126 127 128 129 130 131 132 133 134 135 136 137 138 139 140
#>   3   2   3   2   3   3   2   3   3   3   3   3   3   2   2   3   3   3   2   3
#> 141 142 143 144 145 146 147 148 149 150
#>   3   3   2   3   3   3   2   3   3   2
#>
#> Within cluster sum of squares by cluster:
#> [1] 47.35062 44.08754 47.45019
#>  (between_SS / total_SS =  76.7 %)
#>
#> Available components:
#>
#> [1] "cluster"      "centers"      "totss"        "withinss"     "tot.withinss"
#> [6] "betweenss"    "size"         "iter"         "ifault"

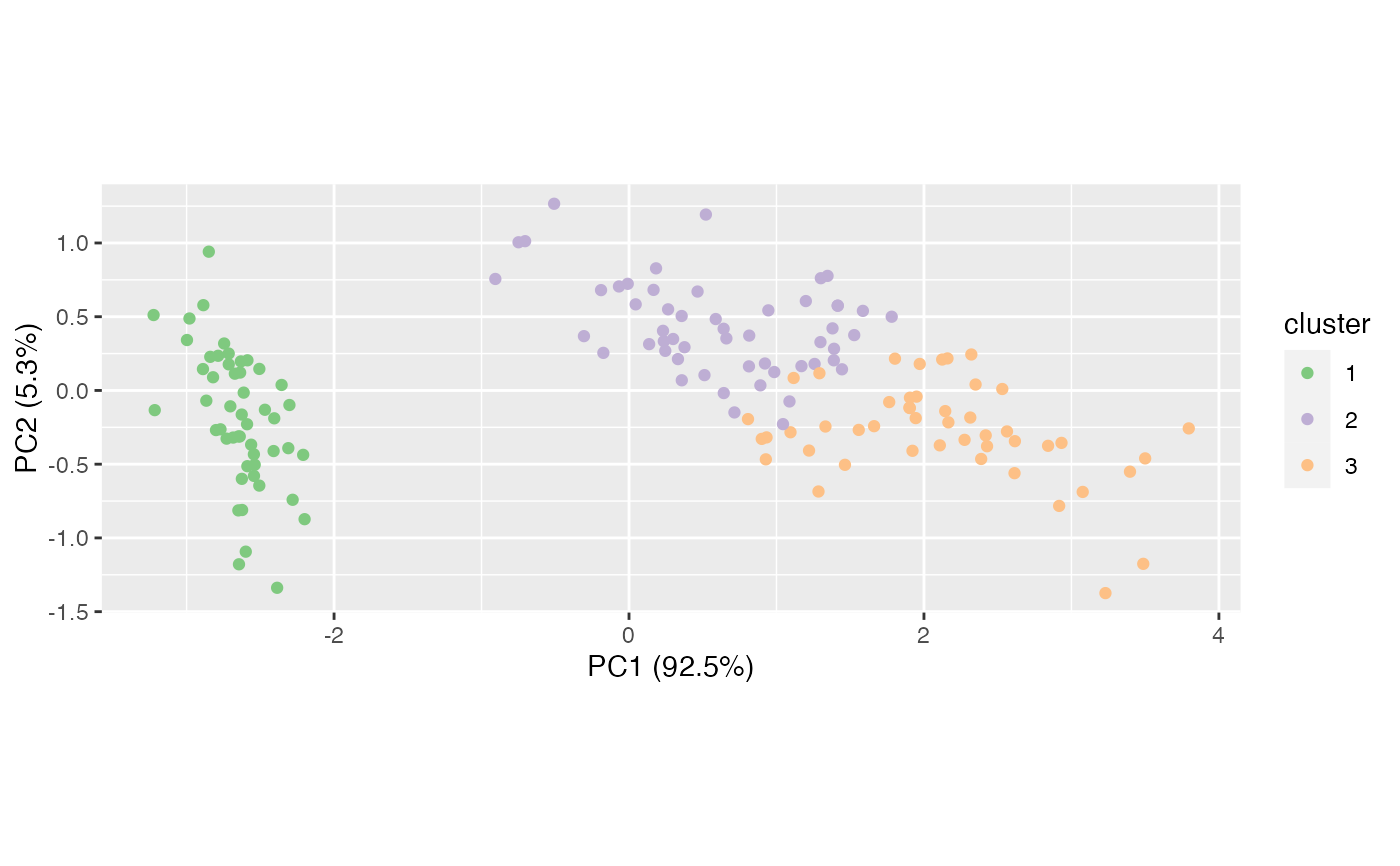
# visualize clusters using PCA
iris %>%
  subset(select = -Species) %>%
  prcomp() %>%
  as_tbl_ord() %>%
  mutate_rows(cluster = iris_km$cluster) %>%
  ggbiplot() +
  geom_rows_point(aes(color = factor(as.character(as.integer(cluster)),
                                     levels = as.character(seq(3L))))) +
  scale_color_brewer(type = "qual", name = "cluster")


# wrap as a 'tbl_ord' object
(iris_km_ord <- as_tbl_ord(iris_km))
#> # A tbl_ord of class 'kmeans': (150 x 3) x (4 x 3)'
#> # 3 coordinates: 1, 2, 3
#> #
#> # Rows: [ 150 x 3 | 0 ]
#>     `1`   `2`   `3` |
#>                     |
#> 1     1     0     0 |
#> 2     1     0     0 |
#> 3     1     0     0 |
#> 4     1     0     0 |
#> 5     1     0     0 |
#> # ℹ 145 more rows |
#>
#> #
#> # Columns: [ 4 x 3 | 0 ]
#>      `1`     `2`    `3` |
#>                         |
#> 1 -1.01  -0.0501 1.13   |
#> 2  0.850 -0.880  0.0881 |
#> 3 -1.30   0.347  0.993  |
#> 4 -1.25   0.281  1.01   |

# augment everything with names, observations with cluster assignment
(iris_km_ord <- augment_ord(iris_km_ord))
#> # A tbl_ord of class 'kmeans': (150 x 3) x (4 x 3)'
#> # 3 coordinates: 1, 2, 3
#> #
#> # Rows: [ 150 x 3 | 2 ]
#>     `1`   `2`   `3` |   name  cluster
#>                     |   <chr> <fct>
#> 1     1     0     0 | 1 1     1
#> 2     1     0     0 | 2 2     1
#> 3     1     0     0 | 3 3     1
#> 4     1     0     0 | 4 4     1
#> 5     1     0     0 | 5 5     1
#> # ℹ 145 more rows | # ℹ 145 more rows
#>
#> #
#> # Columns: [ 4 x 3 | 1 ]
#>      `1`     `2`    `3` |   name
#>                         |   <chr>
#> 1 -1.01  -0.0501 1.13   | 1 Sepal.Length
#> 2  0.850 -0.880  0.0881 | 2 Sepal.Width
#> 3 -1.30   0.347  0.993  | 3 Petal.Length
#> 4 -1.25   0.281  1.01   | 4 Petal.Width

# summarize clusters with standard deviation
iris_km_ord %>%
  tidy() %>%
  transform(sdev = sqrt(withinss / size))
#>   name size withinss inertia prop_var quality      sdev
#> 1    1   50 47.35062      NA       NA      NA 0.9731456
#> 2    2   53 44.08754      NA       NA      NA 0.9120529
#> 3    3   47 47.45019      NA       NA      NA 1.0047779

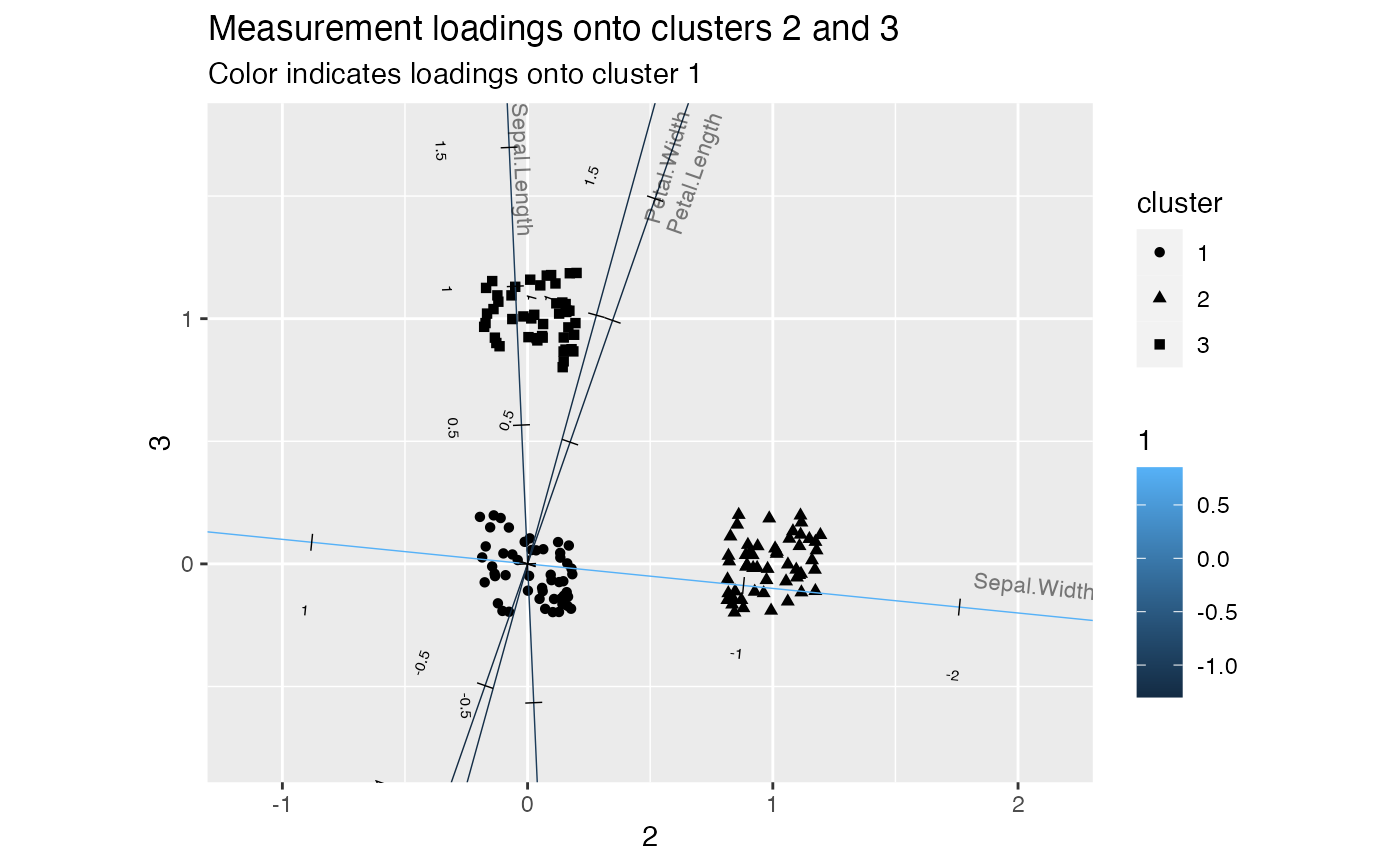
# discriminate between clusters 2 and 3
iris_km_ord %>%
  ggbiplot(aes(x = `2`, y = `3`), color = factor(.cluster)) +
  geom_jitter(stat = "rows", aes(shape = cluster), width = .2, height = .2) +
  geom_cols_axis(aes(color = `1`, label = name),
                 text.size = 2, text_dodge = .1,
                 size = 3, label.alpha = .5) +
  scale_x_continuous(expand = expansion(mult = .8)) +
  scale_y_continuous(expand = expansion(mult = .5)) +
  ggtitle(
    "Measurement loadings onto clusters 2 and 3",
    "Color indicates loadings onto cluster 1"
  )
