Render tick mark text for axes
geom_axis_text.Rdgeom_axis_text() renders tick mark text for specified axes
among the row or column factors.
geom_axis_text(
  mapping = NULL,
  data = NULL,
  stat = "identity",
  position = "identity",
  subset = NULL,
  by = NULL,
  num = NULL,
  label_dodge = 0.15,
  ...,
  parse = FALSE,
  check_overlap = FALSE,
  na.rm = FALSE,
  show.legend = NA,
  inherit.aes = TRUE
)
Arguments
| mapping | Set of aesthetic mappings created by |
|---|---|
| data | The data to be displayed in this layer. There are three options: If A A |
| stat | The statistical transformation to use on the data for this layer, as a string. |
| position | Position adjustment, either as a string, or the result of a call to a position adjustment function. |
| subset | Indices or logical vector of rows or columns for which to render elements. |
| by | Intervals between elements or number of elements; specify only one. |
| num | Intervals between elements or number of elements; specify only one. |
| label_dodge | Numeric; the orthogonal distance of the text from the axis, as a proportion of the minimum of the plot width and height. |
| ... | Additional arguments passed to |
| parse | If |
| check_overlap | If |
| na.rm | Passed to |
| show.legend | logical. Should this layer be included in the legends?
|
| inherit.aes | If |
Biplot layers
ggbiplot() uses ggplot2::fortify() internally to produce a single data
frame with a .matrix column distinguishing the subjects ("rows") and
variables ("cols"). The stat layers stat_rows() and stat_cols() simply
filter the data frame to one of these two.
The geom layers geom_rows_*() and geom_cols_*() call the corresponding
stat in order to render plot elements for the corresponding factor matrix.
geom_dims_*() selects a default matrix based on common practice, e.g.
points for rows and arrows for columns.
Aesthetics
geom_axis_text() understands the following aesthetics (required aesthetics
are in bold):
xyalphaanglecolourfamilyfontfacehjustlineheightsizevjustgroupcenter(for un-scaling)scale(for un-scaling)
See also
Other geom layers:
geom_axis_label(),
geom_axis_ticks(),
geom_axis(),
geom_isolines_text(),
geom_isolines(),
geom_lineranges(),
geom_origin(),
geom_text_radiate(),
geom_unit_circle(),
geom_vector()
Examples
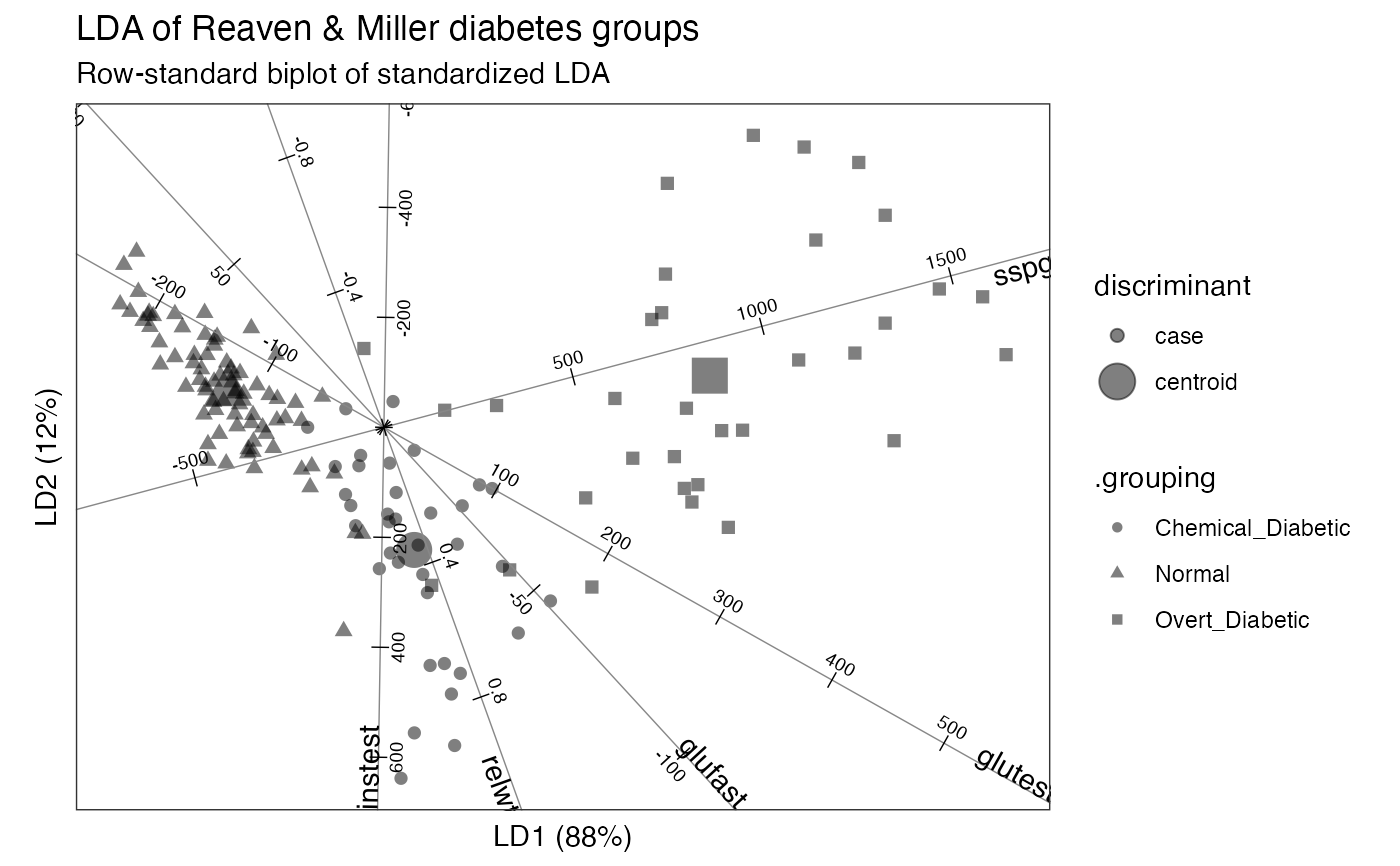
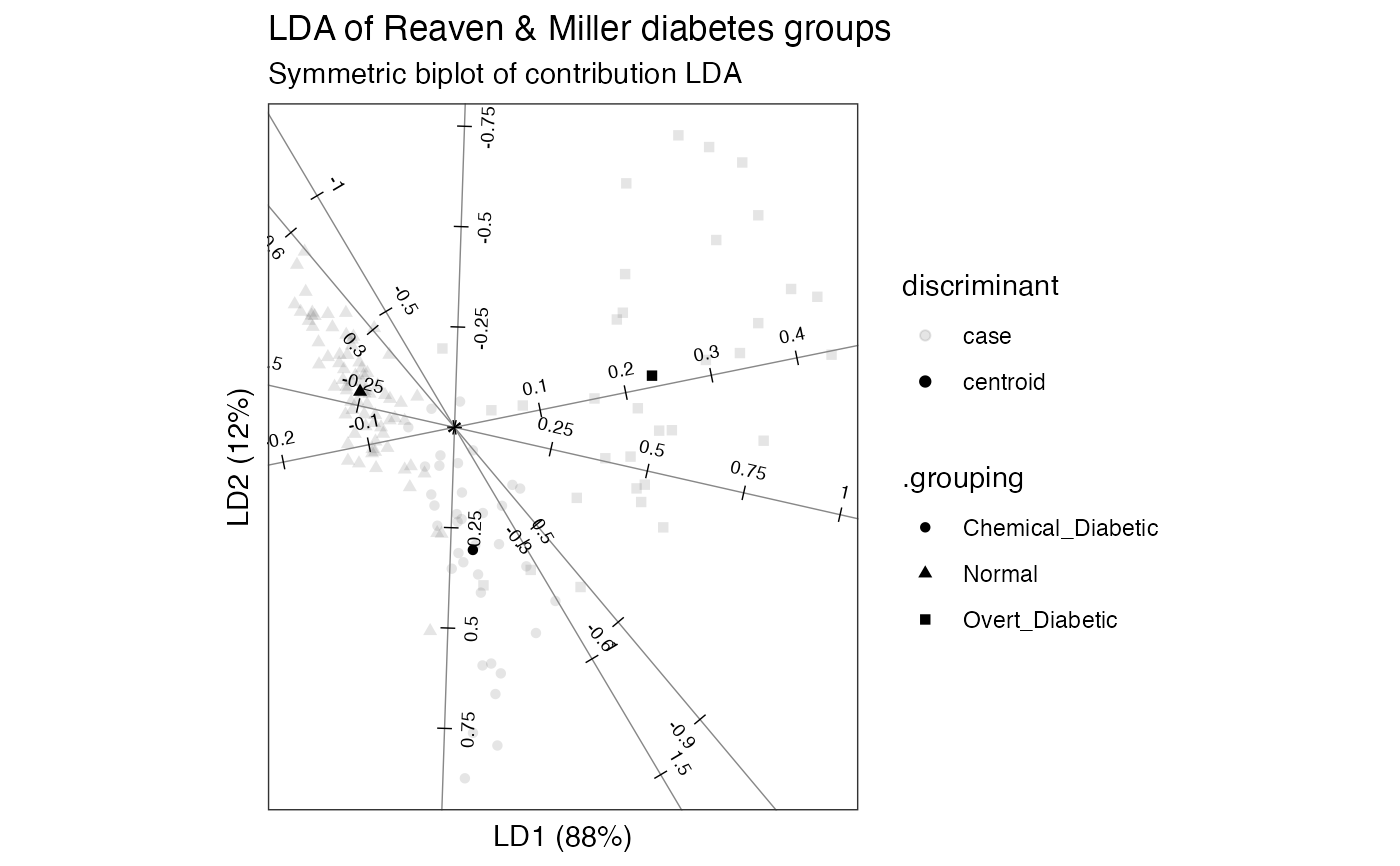
# Reaven & Miller overt & chemical diabetes test data and group classification head(heplots::Diabetes)#> relwt glufast glutest instest sspg group #> 1 0.81 80 356 124 55 Normal #> 2 0.95 97 289 117 76 Normal #> 3 0.94 105 319 143 105 Normal #> 4 1.04 90 356 199 108 Normal #> 5 1.00 90 323 240 143 Normal #> 6 0.76 86 381 157 165 Normal# default (standardized) linear discriminant analysis of groups on tests diabetes_lda <- MASS::lda(group ~ ., heplots::Diabetes) # bestow 'tbl_ord' class & augment observation, centroid, and variable fields as_tbl_ord(diabetes_lda) %>% augment_ord() %>% mutate_rows(discriminant = ifelse(! .supplement, "centroid", "case")) %>% print() -> diabetes_lda#> # A tbl_ord of class 'lda': (148 x 2) x (5 x 2)' #> # 2 coordinates: LD1 and LD2 #> # #> # Rows (principal): [ 148 x 2 | 6 ] #> LD1 LD2 | .name .prior .counts .grouping #> | <chr> <dbl> <int> <chr> #> 1 -1.75 0.400 | 1 Normal 0.524 76 Normal #> 2 0.340 -1.38 | 2 Chemica… 0.248 36 Chemical_… #> 3 3.66 0.580 | 3 Overt_D… 0.228 33 Overt_Dia… #> 4 -1.72 0.663 | 4 1 NA NA Normal #> 5 -2.85 1.30 | 5 2 NA NA Normal #> # … with 143 more rows, and 2 more #> # variables: .supplement <lgl>, #> # discriminant <chr> #> # #> # Columns (standard): [ 5 x 2 | 1 ] #> LD1 LD2 | .name #> | <chr> #> 1 1.36 -3.78 | 1 relwt #> 2 -0.0336 0.0366 | 2 glufast #> 3 0.0126 -0.00709 | 3 glutest #> 4 -0.000102 -0.00617 | 4 instest #> 5 0.00424 0.00113 | 5 sspg# row-standard biplot diabetes_lda %>% confer_inertia(1) %>% ggbiplot() + theme_bw() + theme_biplot() + geom_rows_point(aes(shape = .grouping, size = discriminant), alpha = .5) + geom_cols_axis(color = "#888888") + geom_cols_axis_ticks(num = 8L) + geom_cols_axis_text(size = 2.5, num = 8L, label_dodge = .2) + geom_cols_axis_label(aes(label = .name)) + ggtitle( "LDA of Reaven & Miller diabetes groups", "Row-standard biplot of standardized LDA" )#> Warning: Ignoring unknown aesthetics: label#> Warning: Using size for a discrete variable is not advised.# contribution LDA of groups on tests diabetes_lda <- lda_ord(group ~ ., heplots::Diabetes, axes.scale = "contribution") # bestow 'tbl_ord' class & augment observation, centroid, and variable fields as_tbl_ord(diabetes_lda) %>% augment_ord() %>% mutate_rows(discriminant = ifelse(! .supplement, "centroid", "case")) %>% print() -> diabetes_lda#> # A tbl_ord of class 'lda_ord': (148 x 2) x (5 x 2)' #> # 2 coordinates: LD1 and LD2 #> # #> # Rows (principal): [ 148 x 2 | 6 ] #> LD1 LD2 | .name .prior .counts .grouping #> | <chr> <dbl> <int> <chr> #> 1 -1.75 0.400 | 1 Normal 0.524 76 Normal #> 2 0.340 -1.38 | 2 Chemica… 0.248 36 Chemical_… #> 3 3.66 0.580 | 3 Overt_D… 0.228 33 Overt_Dia… #> 4 -1.72 0.663 | 4 1 NA NA Normal #> 5 -2.85 1.30 | 5 2 NA NA Normal #> # … with 143 more rows, and 2 more #> # variables: .supplement <lgl>, #> # discriminant <chr> #> # #> # Columns (standard): [ 5 x 2 | 1 ] #> LD1 LD2 | .name #> | <chr> #> 1 0.138 -0.384 | 1 relwt #> 2 -0.274 0.539 | 2 glufast #> 3 0.861 0.288 | 3 glutest #> 4 -0.0134 -0.666 | 4 instest #> 5 0.388 -0.145 | 5 sspg# symmetric biplot diabetes_lda %>% confer_inertia(.5) %>% ggbiplot() + theme_bw() + theme_biplot() + geom_rows_point(aes(shape = .grouping, alpha = discriminant)) + geom_cols_axis(color = "#888888") + geom_cols_axis_ticks(num = 8L) + geom_cols_axis_text(size = 2.5, num = 8L, label_dodge = .1) + ggtitle( "LDA of Reaven & Miller diabetes groups", "Symmetric biplot of contribution LDA" )#> Warning: Using alpha for a discrete variable is not advised.

