These functions return tibbles that summarize
an object of class 'tbl_ord'. tidy() output contains one row per
artificial coordinate and glance() output contains one row for the whole
ordination.
Arguments
- x, model
An object of class 'tbl_ord'.
- ...
Additional arguments allowed by generics; currently ignored.
- data
Passed to generic methods; currently ignored.
- .matrix
A character string partially matched (lowercase) to several indicators for one or both matrices in a matrix decomposition used for ordination. The standard values are
"rows","cols", and"dims"(for both).- elements
Character vector; which elements of each factor for which to render graphical elements. One of
"all"(the default),"active", or any supplementary element type defined by the specific class methods (e.g."score"for 'factanal', 'lda_ord', and 'cancord_ord' and"intraset"and"interset"for 'cancor_ord').
Value
A tibble.
Details
Three generics popularized by the ggplot2 and broom packages make use of the augmentation methods:
The
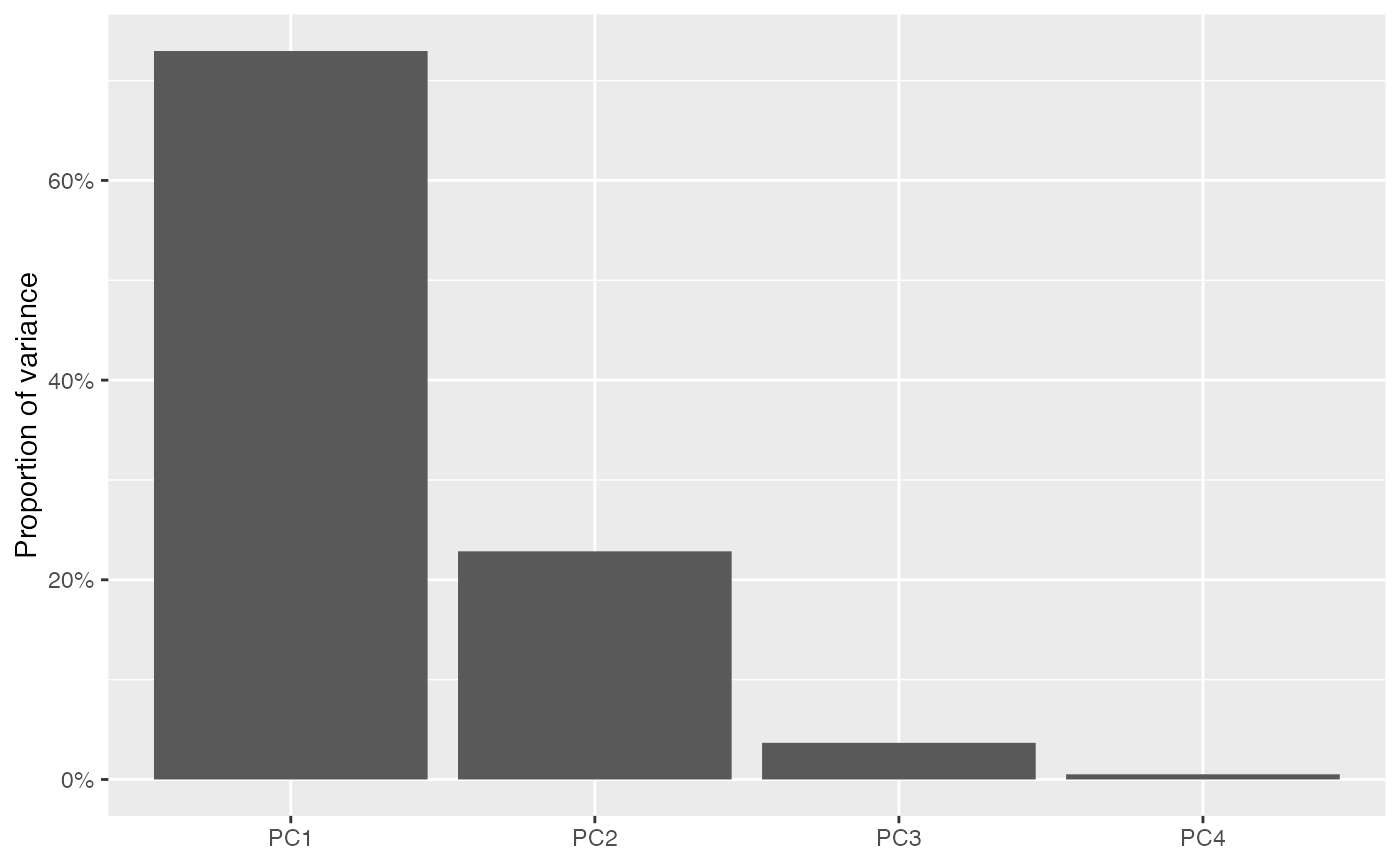
generics::tidy()method summarizes information about model components, which here are the artificial coordinates created by ordinations. The output can be passed toggplot2::ggplot()to generate scree plots. The returned columns arename: (the name of) the coordinateother columns extracted from the model, usually a single additional column of the singular or eigen values
inertia: the multidimensional varianceprop_var: the proportion of inertiaquality: the cumulative proportion of variance
The
generics::glance()method reports information about the entire model, here always treated as one of a broader class of ordination models. The returned columns arerank: the rank of the ordination model, i.e. the number of ordinatesn.row,n.col: the dimensions of the decomposed matrixinertia: the total inertia in the ordinationprop.var.*: the proportion of variance in the first 2 ordinatesclass: the class of the wrapped model object
The
ggplot2::fortify()method augments and collapses row and/or column data, depending on.matrixand.element, into a single tibble, in preparation forggplot2::ggplot(). Its output resembles that ofgenerics::augment(), though rows in the output may correspond to rows, columns, or both of the original data. If.matrixis passed"rows","cols", or"dims"(for both), thenfortify()returns a tibble whose fields are obtained, in order, viaget_*(),recover_aug_*(), andannotation_*().
The tibble is assigned a "coordinates" attribute whose value is obtained
via get_coord(). This facilitates some downstream functionality that relies
on more than those coordinates used as position aesthetics in a biplot, in
particular stat_spantree().
See also
augmentation methods that must interface with tidiers.
Examples
# illustrative ordination: PCA of iris data
iris_pca <- ordinate(iris, ~ prcomp(., center = TRUE, scale. = TRUE), seq(4L))

# use `tidy()` to summarize distribution of inertia
tidy(iris_pca)
#> # A tibble: 4 × 5
#>   name   sdev inertia prop_var quality
#>   <fct> <dbl>   <dbl>    <dbl>   <dbl>
#> 1 PC1   1.71   435.    0.730     0.730
#> 2 PC2   0.956  136.    0.229     0.958
#> 3 PC3   0.383   21.9   0.0367    0.995
#> 4 PC4   0.144    3.09  0.00518   1
# this facilitates scree plots
tidy(iris_pca) %>%
  ggplot(aes(x = name, y = prop_var)) +
  geom_col() +
  scale_y_continuous(labels = scales::percent) +
  labs(x = NULL, y = "Proportion of variance")


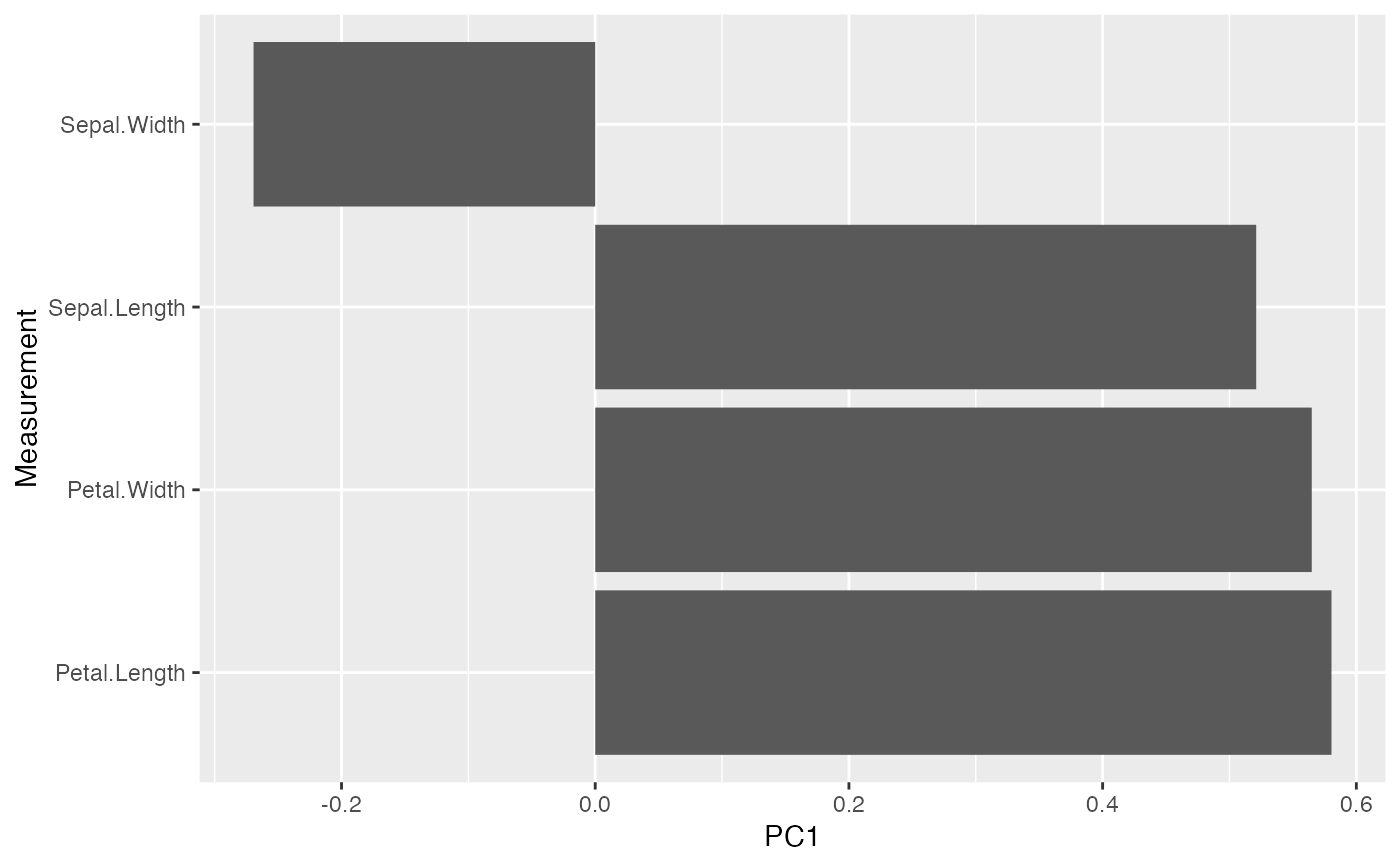
# use `fortify()` to prepare either matrix factor for `ggplot()`
fortify(iris_pca, .matrix = "V") %>%
  ggplot(aes(x = name, y = PC1)) +
  geom_col() +
  coord_flip() +
  labs(x = "Measurement")

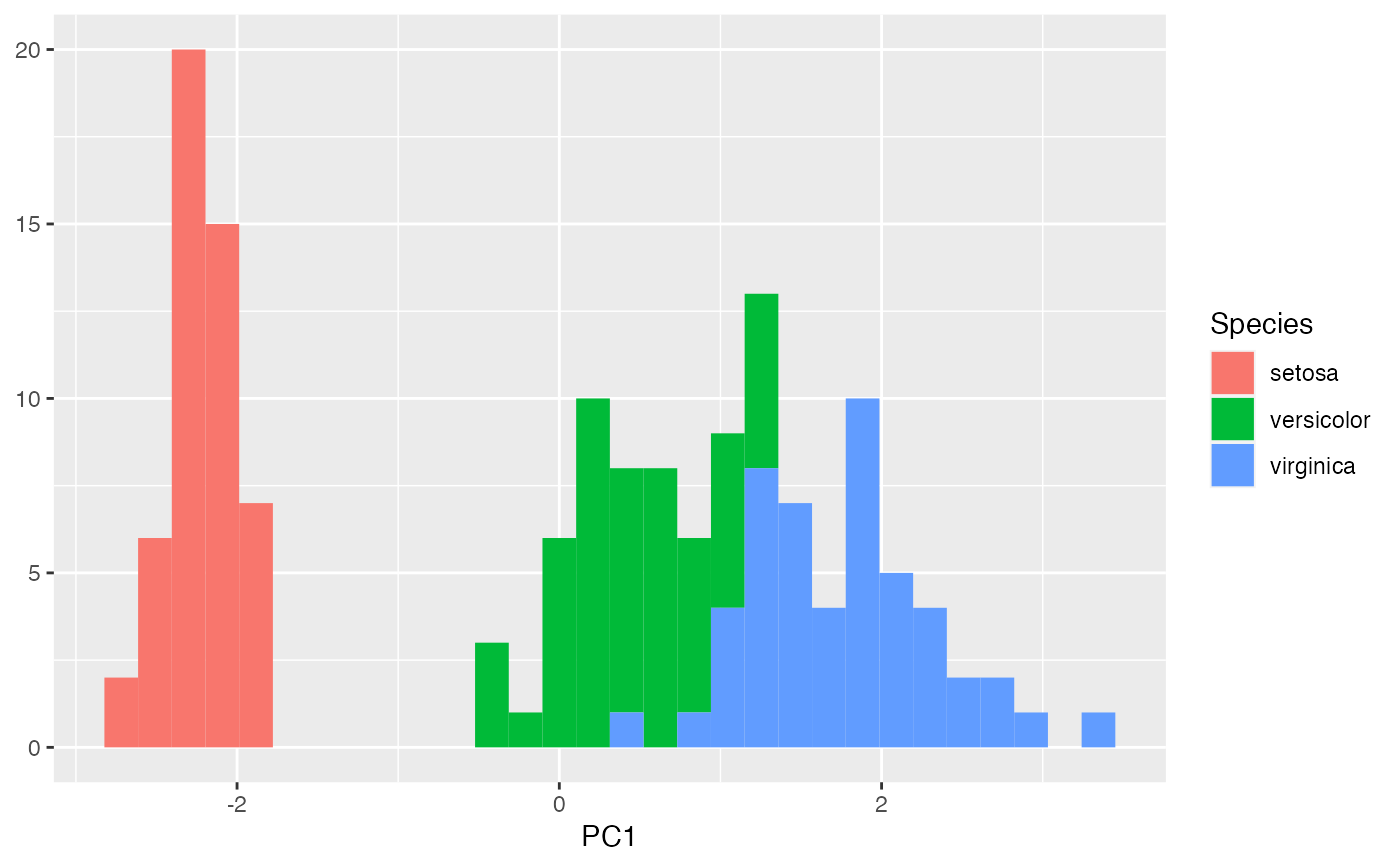
iris_pca %>%
  fortify(.matrix = "U") %>%
  ggplot(aes(x = PC1, fill = Species)) +
  geom_histogram() +
  labs(y = NULL)
#> `stat_bin()` using `bins = 30`. Pick better value with `binwidth`.

# ... or to prepare both for `ggbiplot()`
fortify(iris_pca)
#> # A tibble: 154 × 10
#>      PC1     PC2     PC3      PC4 Species .element .matrix name  center scale
#>    <dbl>   <dbl>   <dbl>    <dbl> <fct>   <chr>    <chr>   <chr>  <dbl> <dbl>
#>  1 -2.26 -0.478   0.127   0.0241  setosa  active   rows    NA        NA    NA
#>  2 -2.07  0.672   0.234   0.103   setosa  active   rows    NA        NA    NA
#>  3 -2.36  0.341  -0.0441  0.0283  setosa  active   rows    NA        NA    NA
#>  4 -2.29  0.595  -0.0910 -0.0657  setosa  active   rows    NA        NA    NA
#>  5 -2.38 -0.645  -0.0157 -0.0358  setosa  active   rows    NA        NA    NA
#>  6 -2.07 -1.48   -0.0269  0.00659 setosa  active   rows    NA        NA    NA
#>  7 -2.44 -0.0475 -0.334  -0.0367  setosa  active   rows    NA        NA    NA
#>  8 -2.23 -0.222   0.0884 -0.0245  setosa  active   rows    NA        NA    NA
#>  9 -2.33  1.11   -0.145  -0.0268  setosa  active   rows    NA        NA    NA
#> 10 -2.18  0.467   0.253  -0.0398  setosa  active   rows    NA        NA    NA
#> # ℹ 144 more rows

# use `glance()` to summarize the model as an ordination
glance(iris_pca)
#> # A tibble: 1 × 7
#>    rank n.row n.col inertia prop.var.1 prop.var.2 class
#>   <int> <int> <int>   <dbl>      <dbl>      <dbl> <chr>
#> 1     4   150     4    596.      0.730      0.229 prcomp
# this enables comparisons to other models
rbind(
  glance(ordinate(subset(iris, Species == "setosa"), prcomp, seq(4L))),
  glance(ordinate(subset(iris, Species == "versicolor"), prcomp, seq(4L))),
  glance(ordinate(subset(iris, Species == "virginica"), prcomp, seq(4L)))
)
#> # A tibble: 3 × 7
#>    rank n.row n.col inertia prop.var.1 prop.var.2 class
#>   <int> <int> <int>   <dbl>      <dbl>      <dbl> <chr>
#> 1     4    50     4    15.2      0.765      0.119 prcomp
#> 2     4    50     4    30.6      0.781      0.116 prcomp
#> 3     4    50     4    43.5      0.783      0.120 prcomp