Log-ratio analysis
lra.RdRepresent log-ratios between variables based on their values on a population of cases.
lra(x, compositional = FALSE, weighted = TRUE)
Arguments
| x | A numeric matrix or rectangular data set. |
|---|---|
| compositional | Logical; whether to normalize rows of |
| weighted | Logical; whether to weight rows and columns by their sums. |
Details
Log-ratio analysis (LRA) is based on a double-centering of log-transformed data, usually weighted by row and column totals. The technique is suitable for positive-valued variables on a common scale (e.g. percentages). The distances between variables' coordinates (in the full-dimensional space) are their pairwise log-ratios. The distances between cases' coordinates are called their log-ratio distances, and the total variance is the weighted sum of their squares.
LRA is not implemented in standard R distributions but is a useful member of the ordination toolkit. This is a minimal implementation following Greenacre's (2010) exposition in Chapter 7.
References
Greenacre MJ (2010) Biplots in Practice. Fundacion BBVA, ISBN: 978-84-923846. https://www.fbbva.es/microsite/multivariate-statistics/biplots.html
Examples
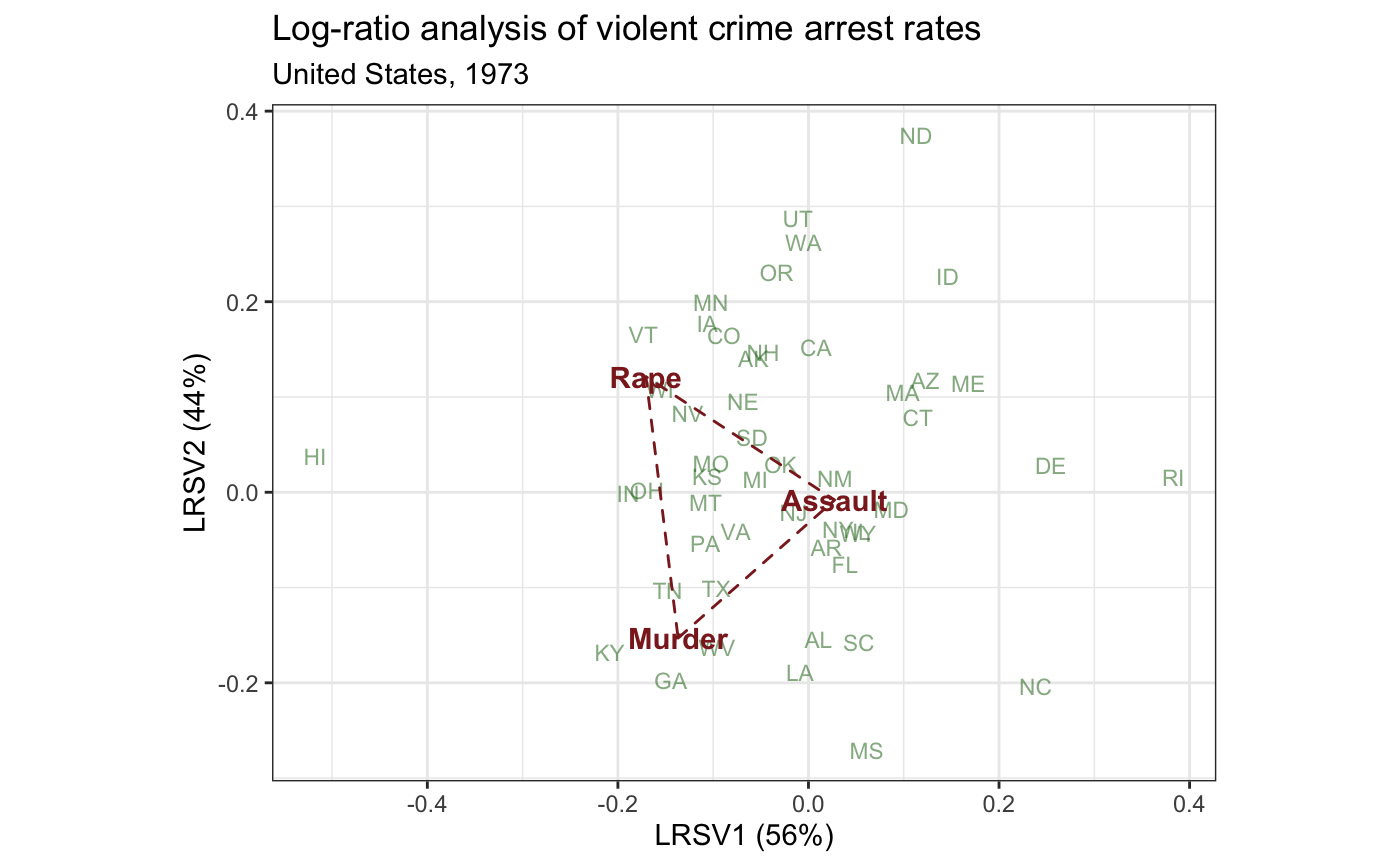
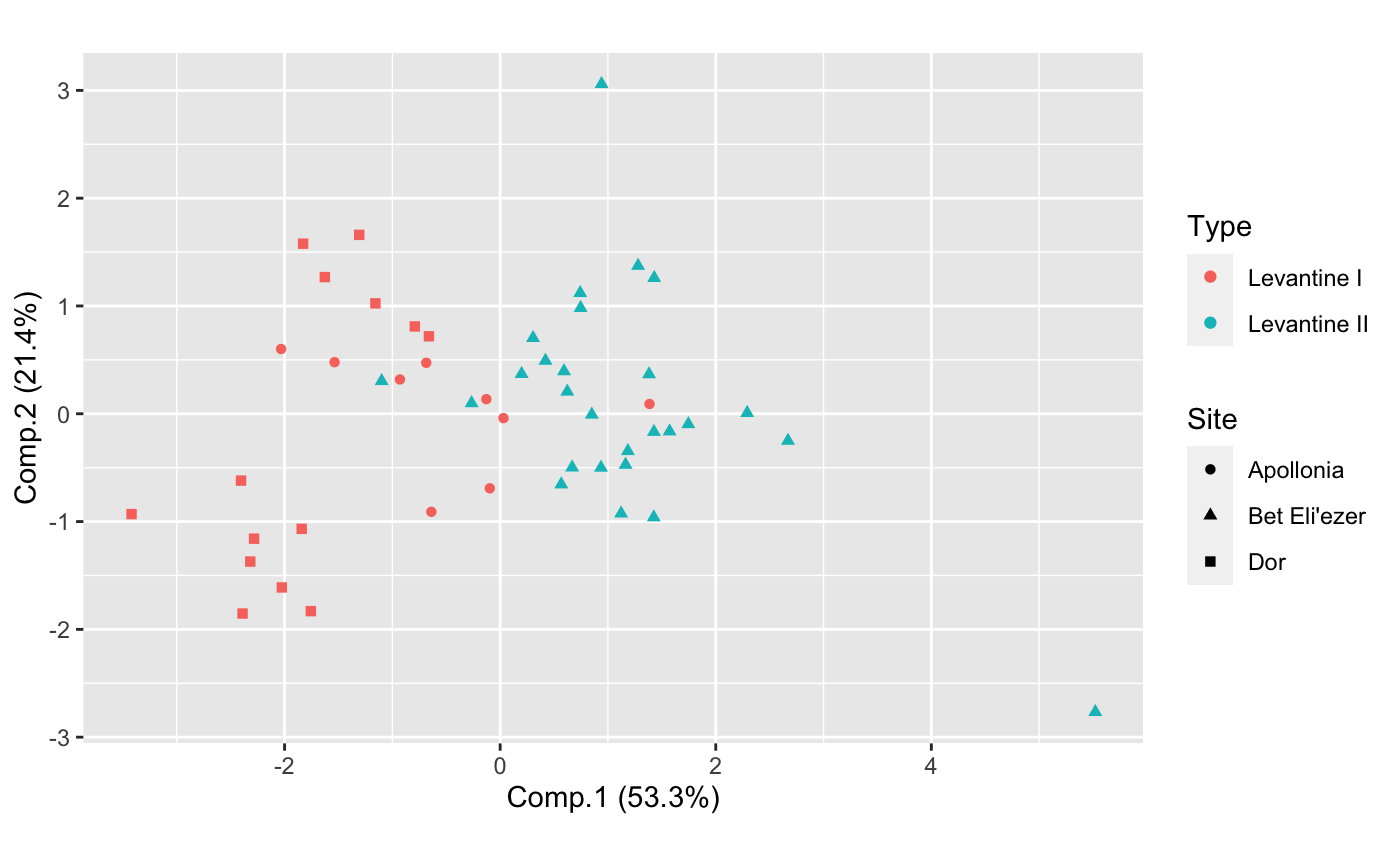
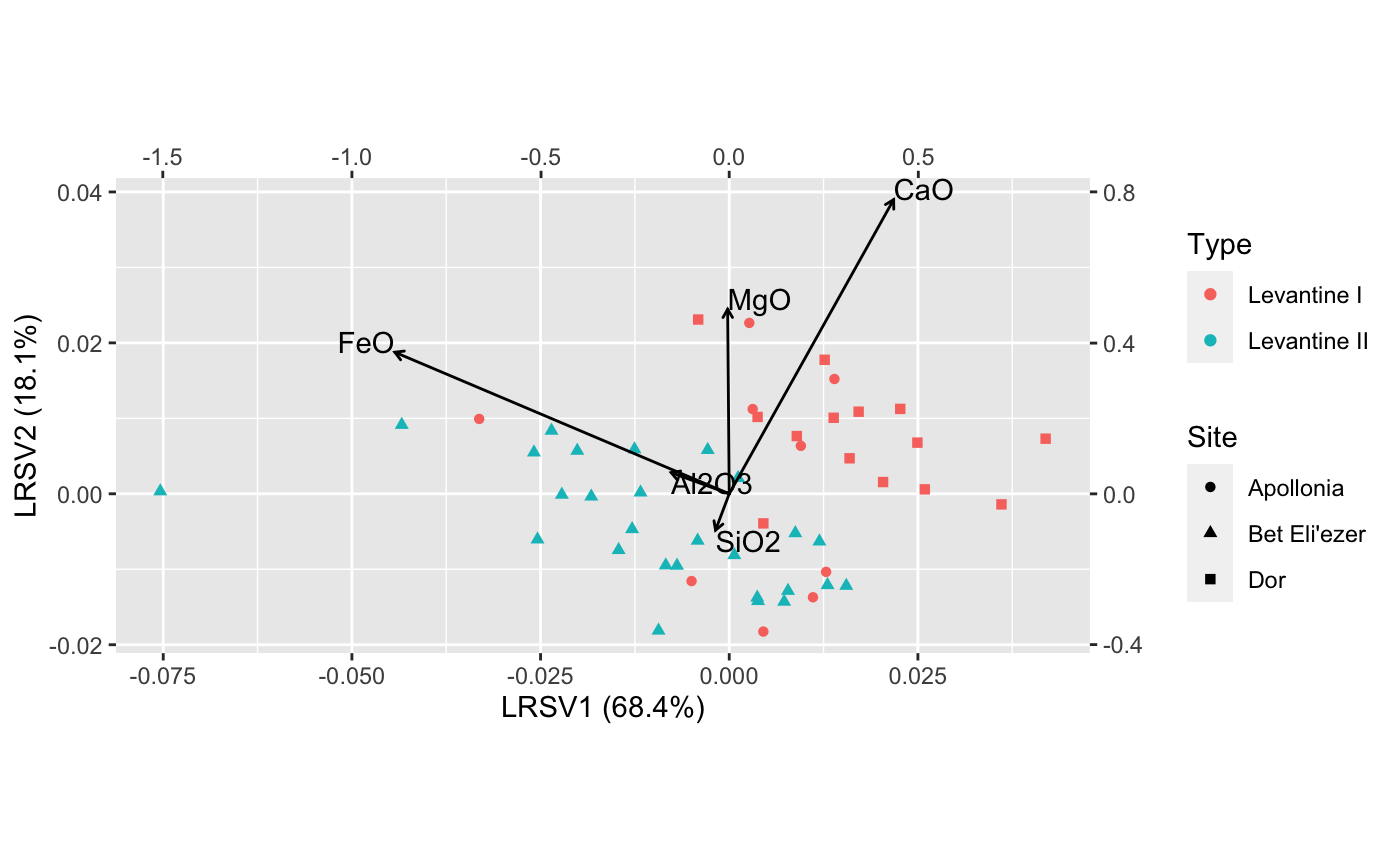
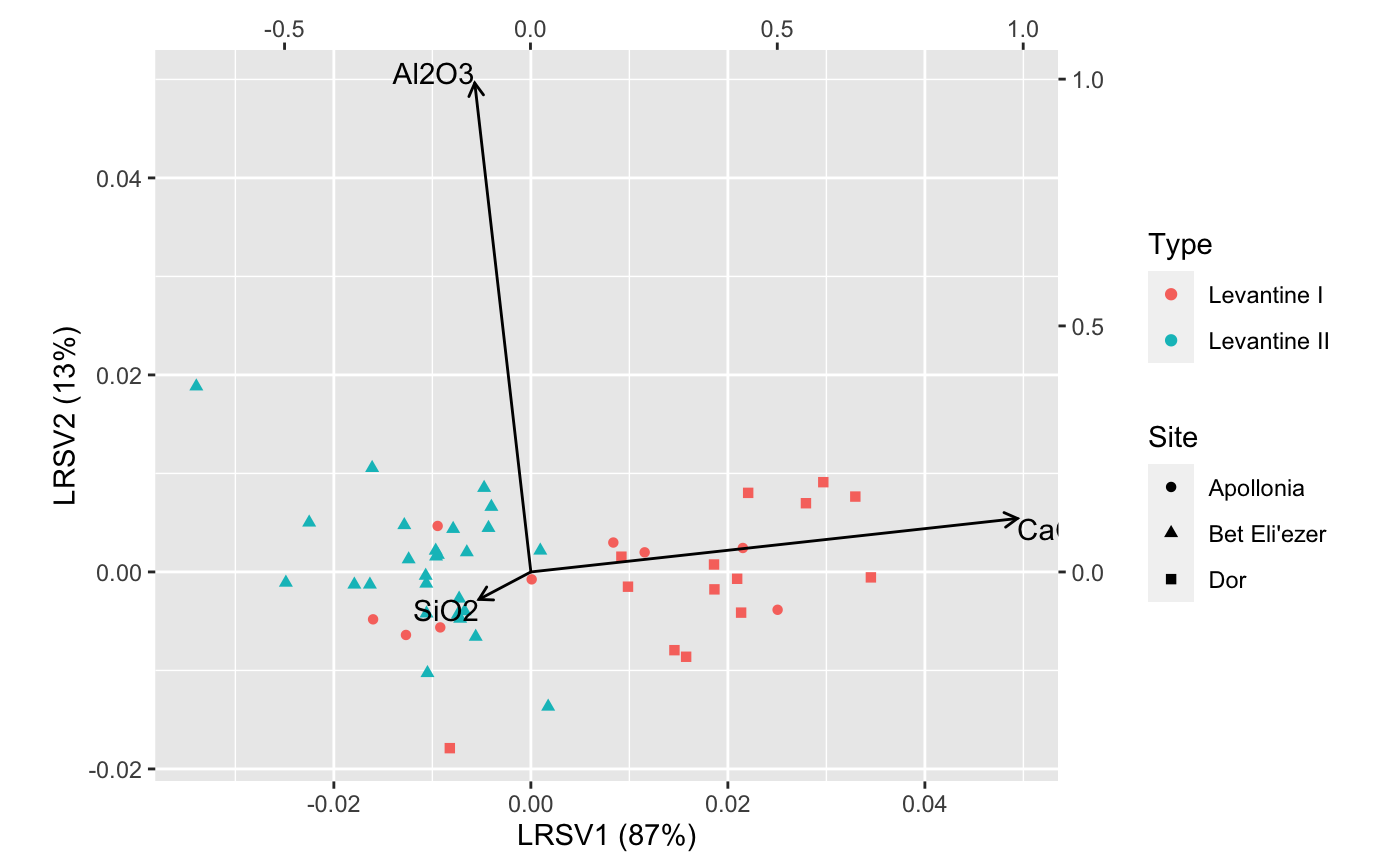
# state abbreviations state <- data.frame( .name = state.name, .abb = state.abb ) # Log-ratio analysis of 1973 violent crime arrests in the United States (arrests_lra <- lra(USArrests[, -3]))#> $sv #> [1] 2.204112e-01 1.955308e-01 3.611972e-17 #> #> $row.coords #> LRSV1 LRSV2 LRSV3 #> Alabama 0.010615205 -0.154354831 0.000504474 #> Alaska -0.057591949 0.140420691 -0.388950513 #> Arizona 0.122533520 0.117731230 -0.128931162 #> Arkansas 0.019003125 -0.057570010 0.046656229 #> California 0.008048189 0.152555368 -0.194647240 #> Colorado -0.088544329 0.165191709 -0.176839484 #> Connecticut 0.114914374 0.078388742 0.152246942 #> Delaware 0.254404723 0.027738214 0.065378168 #> Florida 0.038322260 -0.075250154 -0.104178028 #> Georgia -0.144534606 -0.197209278 -0.001773386 #> Hawaii -0.517966256 0.037682024 0.131828250 #> Idaho 0.146074842 0.226414450 0.093736056 #> Illinois 0.055743135 -0.040975696 -0.011590488 #> Indiana -0.189048944 -0.001430056 0.042220610 #> Iowa -0.106196974 0.177110727 0.147313308 #> Kansas -0.106109005 0.017156253 0.061587110 #> Kentucky -0.208305191 -0.167831194 0.177365031 #> Louisiana -0.008876611 -0.188899013 0.036076396 #> Maine 0.167813476 0.114397455 0.242547594 #> Maryland 0.086925006 -0.018104279 -0.043070900 #> Massachusetts 0.099138407 0.105165647 0.066897581 #> Michigan -0.055609969 0.013370015 -0.112975853 #> Minnesota -0.102328093 0.198935243 0.120259543 #> Mississippi 0.061157476 -0.271151272 0.143459550 #> Missouri -0.102330996 0.030557137 -0.034811620 #> Montana -0.108096691 -0.010780957 0.137773063 #> Nebraska -0.068793707 0.094967891 0.067965116 #> Nevada -0.126676545 0.082627444 -0.194315390 #> New Hampshire -0.047343104 0.146575509 0.217339215 #> New Jersey -0.015533629 -0.021150027 0.060993578 #> New Mexico 0.028018230 0.014809770 -0.088437504 #> New York 0.031015361 -0.038443084 -0.030852173 #> North Carolina 0.238710415 -0.203606592 0.060854905 #> North Dakota 0.113262797 0.375070000 0.310268430 #> Ohio -0.169487280 0.002486830 0.046883531 #> Oklahoma -0.029114491 0.029620445 0.033183707 #> Oregon -0.033333759 0.231295924 -0.127555445 #> Pennsylvania -0.108228198 -0.053845680 0.140606127 #> Rhode Island 0.383008304 0.016023240 0.245758125 #> South Carolina 0.053157130 -0.157299823 0.023269461 #> South Dakota -0.059025984 0.057407710 0.137557910 #> Tennessee -0.147702807 -0.102998683 -0.020221878 #> Texas -0.096901237 -0.101159928 -0.012331317 #> Utah -0.010994131 0.287482498 -0.061746384 #> Vermont -0.173205241 0.166220864 0.178183930 #> Virginia -0.076192471 -0.041200499 0.031532613 #> Washington -0.005238875 0.261857381 -0.078588729 #> West Virginia -0.096070469 -0.162793377 0.237276612 #> Wisconsin -0.155521884 0.107882784 0.266067747 #> Wyoming 0.052133816 -0.043174888 0.106248663 #> #> $column.coords #> LRSV1 LRSV2 LRSV3 #> Murder -0.6207877 -0.78267386 -0.04521307 #> Assault 0.1245533 -0.04152361 -0.99134367 #> Rape -0.7740214 0.62104542 -0.12326194 #> #> attr(,"class") #> [1] "lra"arrests_lra %>% as_tbl_ord() %>% augment() %>% left_join_u(state, by = ".name") %>% print() -> arrests_lra#> # A tbl_ord of class 'lra': (50 x 3) x (3 x 3)' #> # 3 coordinates: LRSV1, LRSV2, LRSV3 #> # #> # U: [ 50 x 3 | 2 ] #> LRSV1 LRSV2 LRSV3 | .name .abb #> | <chr> <chr> #> 1 0.0106 -0.154 0.000504 | 1 Alabama AL #> 2 -0.0576 0.140 -0.389 | 2 Alaska AK #> 3 0.123 0.118 -0.129 | 3 Arizona AZ #> 4 0.0190 -0.0576 0.0467 | 4 Arkansas AR #> 5 0.00805 0.153 -0.195 | 5 California CA #> # … with 45 more rows #> # #> # V: [ 3 x 3 | 1 ] #> LRSV1 LRSV2 LRSV3 | .name #> | <chr> #> 1 -0.621 -0.783 -0.0452 | 1 Murder #> 2 0.125 -0.0415 -0.991 | 2 Assault #> 3 -0.774 0.621 -0.123 | 3 Rape# Adapt Exhibit 7.1 in Greenacre (2010) arrests_lra %>% confer_inertia(0) %>% ggbiplot() + #ggbiplot(sec.axes = "v") + theme_bw() + geom_u_text( aes(label = .abb), size = 3, color = "darkgreen", alpha = .5 ) + geom_v_polygon(fill = NA, linetype = "dashed", color = "brown4") + geom_v_text( aes(label = .name), color = "brown4", fontface = "bold" ) + ggtitle( "Log-ratio analysis of violent crime arrest rates", "United States, 1973" ) + guides(color = FALSE, size = FALSE)# Compare PCA to LRA on the Freestone primary class composition data # following Baxter & Freestone (2006) # (do not exclude compositional outliers) data(glass) levantine_glass <- glass %>% dplyr::filter(Site != "Banias") %>% dplyr::mutate(Type = dplyr::case_when( Site == "Dor" ~ "Levantine I", Site == "Apollonia" ~ "Levantine I", Site == "Bet Eli'ezer" ~ "Levantine II" )) # scaled principal components analysis levantine_glass %>% dplyr::select(SiO2, Al2O3, CaO, FeO, MgO) %>% princomp(cor = TRUE) %>% as_tbl_ord() %>% bind_cols_u(dplyr::select(levantine_glass, Site, Type)) %>% print() -> pca_glass#> # A tbl_ord of class 'princomp': (50 x 5) x (5 x 5)' #> # 5 coordinates: Comp.1, Comp.2, ..., Comp.5 #> # #> # U: [ 50 x 5 | 2 ] #> Comp.1 Comp.2 Comp.3 ... | Site Type #> | <chr> <chr> #> 1 1.43 -0.167 1.29 | 1 Bet Eli'ezer Levantine II #> 2 2.67 -0.250 -1.44 ... | 2 Bet Eli'ezer Levantine II #> 3 1.16 -0.473 0.387 | 3 Bet Eli'ezer Levantine II #> 4 0.199 0.370 1.14 | 4 Bet Eli'ezer Levantine II #> 5 0.305 0.703 0.930 | 5 Bet Eli'ezer Levantine II #> # … with 45 more rows #> # #> # V: [ 5 x 5 | 0 ] #> Comp.1 Comp.2 Comp.3 ... | #> | #> 1 0.510 0.272 0.405 | #> 2 0.489 -0.337 -0.381 ... | #> 3 -0.510 -0.181 -0.463 | #> 4 0.490 -0.176 -0.501 | #> 5 0.0234 0.865 -0.474 |# completely compositional log-ratio analysis levantine_glass %>% dplyr::select(SiO2, Al2O3, CaO, FeO, MgO) %>% lra(compositional = TRUE) %>% as_tbl_ord() %>% confer_inertia("rows") %>% bind_cols_u(dplyr::select(levantine_glass, Site, Type)) %>% print() -> lra_glass#> # A tbl_ord of class 'lra': (50 x 5) x (5 x 5)' #> # 5 coordinates: LRSV1, LRSV2, ..., LRSV5 #> # #> # U: [ 50 x 5 | 2 ] #> LRSV1 LRSV2 LRSV3 ... | Site Type #> | <chr> <chr> #> 1 -0.00937 -0.0181 -0.00163 | 1 Bet Eli'ezer Levantine II #> 2 -0.0434 0.00914 0.000724 ... | 2 Bet Eli'ezer Levantine II #> 3 -0.0129 -0.00467 0.00486 | 3 Bet Eli'ezer Levantine II #> 4 0.0130 -0.0121 -0.00257 | 4 Bet Eli'ezer Levantine II #> 5 0.0155 -0.0122 -0.00661 | 5 Bet Eli'ezer Levantine II #> # … with 45 more rows #> # #> # V: [ 5 x 5 | 0 ] #> LRSV1 LRSV2 LRSV3 ... | #> | #> 1 -0.0363 -0.0963 -0.0539 | #> 2 -0.154 0.0560 0.298 ... | #> 3 0.436 0.779 0.421 | #> 4 -0.886 0.375 0.161 | #> 5 -0.00418 0.489 -0.840 |ggbiplot(lra_glass, sec.axes = "v", scale.factor = .05) + geom_u_point(aes(shape = Site, color = Type)) + geom_v_vector() + geom_v_text(aes(label = .name), hjust = "outward", vjust = "outward")# completely compositional log-ratio analysis with FeO and MgO excluded levantine_glass %>% dplyr::select(SiO2, Al2O3, CaO) %>% lra(compositional = TRUE) %>% as_tbl_ord() %>% confer_inertia("rows") %>% bind_cols_u(dplyr::select(levantine_glass, Site, Type)) %>% print() -> lra_glass#> # A tbl_ord of class 'lra': (50 x 3) x (3 x 3)' #> # 3 coordinates: LRSV1, LRSV2, LRSV3 #> # #> # U: [ 50 x 3 | 2 ] #> LRSV1 LRSV2 LRSV3 | Site Type #> | <chr> <chr> #> 1 -0.0249 -0.00109 3.63e-18 | 1 Bet Eli'ezer Levantine II #> 2 -0.0161 0.0106 1.01e-18 | 2 Bet Eli'ezer Levantine II #> 3 -0.00944 0.00174 -2.85e-20 | 3 Bet Eli'ezer Levantine II #> 4 -0.00560 -0.00658 -4.09e-20 | 4 Bet Eli'ezer Levantine II #> 5 -0.00718 -0.00475 -2.17e-19 | 5 Bet Eli'ezer Levantine II #> # … with 45 more rows #> # #> # V: [ 3 x 3 | 0 ] #> LRSV1 LRSV2 LRSV3 | #> | #> 1 -0.105 -0.0557 -0.993 | #> 2 -0.114 0.993 -0.0436 | #> 3 0.988 0.109 -0.111 |ggbiplot(lra_glass, sec.axes = "v", scale.factor = .05) + geom_u_point(aes(shape = Site, color = Type)) + geom_v_vector() + geom_v_text(aes(label = .name), hjust = "outward", vjust = "outward")


