Sites, types, and compositions of glass samples from archaeological sites in Israel.
Usage
data(glass)Format
A tibble with 68 cases and 16 variables:
Sitesite at which sample was found
Analanalysis identifier
Contextfurnace identifier
Formtype of sample
SiO2, TiO2, Al2O3, FeO, MnO, MgO, CaO, Na2O, K2O, P2O5, Cl, SO3normalized weight percent oxide of each component
Details
Chunks of unformed glass from several furnaces found at the primary Byzantine-era site of Bet Eli'ezer, along with samples from other sites with weaker evidence of glass-making (Apollonia and Dor) and and from an Islamic-era site (Banias), were analyzed using X-ray spectrometry to determine their major components.
Baxter & Freestone (2006) used these data to illustrate log-ratio analysis.
References
Freestone IC, Gorin-Rosen Y, & Hughes MJ (2000) "Primary glass from Israel and the production of glass in Late Antiquity and the early Islamic period". La route du verre: Ateliers primaires et secondaires du second millénaire av. J.-C. au Moyen Âge: 65–83. https://pascal-francis.inist.fr/vibad/index.php?action=getRecordDetail&idt=1158762
Baxter MJ & Freestone IC (2006) "Log-Ratio Compositional Data Analysis in Archaeometry". Archaeometry, 48(3): 511–531. doi:10.1111/j.1475-4754.2006.00270.x
Examples
# subset glass data to one site and major components
head(glass)
#> # A tibble: 6 × 16
#> Site Anal Context Form SiO2 TiO2 Al2O3 FeO MnO MgO CaO Na2O
#> <chr> <chr> <chr> <chr> <dbl> <dbl> <dbl> <dbl> <dbl> <dbl> <dbl> <dbl>
#> 1 Bet Eli'e… 1 L14.B1… Chunk 76.0 NA 3.29 0.45 0.1 0.57 5.96 12.1
#> 2 Bet Eli'e… 2 L14.B1… Chunk 73.6 0.16 3.7 0.85 NA 0.68 6.65 13.0
#> 3 Bet Eli'e… 3 L14.B1… Chunk 75.0 0.13 3.36 0.53 NA 0.58 7.27 11.4
#> 4 Bet Eli'e… 4 L14.B1… Chunk 76.0 NA 3.06 0.35 0.1 0.61 7.63 11.3
#> 5 Bet Eli'e… 5 L14.B1… Chunk 75.9 NA 3.13 0.33 NA 0.65 7.49 11.4
#> 6 Bet Eli'e… 6 L14.B1… Chunk 74.4 0.14 3.33 0.45 NA 0.62 7.2 12.6
#> # ℹ 4 more variables: K2O <dbl>, P2O5 <dbl>, Cl <dbl>, SO3 <dbl>
glass_main <- subset(
glass,
Site == "Bet Eli'ezer",
select = c("SiO2", "Na2O", "CaO", "Al2O3", "MgO", "K2O")
)
# format as a data frame with row names
glass_main <- as.data.frame(glass_main)
rownames(glass_main) <- subset(glass, Site == "Bet Eli'ezer")$Anal
# perform log-ratio analysis
glass_lra <- lra(glass_main, compositional = TRUE, weighted = FALSE)
# inspect LRA row and column coordinates
head(glass_lra$row.coords)
#> LRSV1 LRSV2 LRSV3 LRSV4 LRSV5
#> 1 -0.04710674 -0.71421468 -0.1481599 2.0743704 1.4967846
#> 2 1.06477553 0.29251672 0.7714624 0.8939097 -0.9176510
#> 3 0.18390009 -0.41583336 -0.6223075 -0.6353946 -0.2492736
#> 4 -0.50865018 0.05740889 -0.5126957 -1.0951873 0.7896664
#> 5 -0.86538619 0.38109842 -0.6578733 -0.1765439 0.1192224
#> 6 -1.37184826 -0.53735808 -0.3574370 1.4192209 -1.3690434
glass_lra$column.coords
#> LRSV1 LRSV2 LRSV3 LRSV4 LRSV5
#> SiO2 -0.3208528 -0.4140707 -1.1214862 0.3234513 1.83391575
#> Na2O -0.5797004 -1.0229552 1.7646198 0.7054758 0.07701303
#> CaO -1.1181033 -0.2446487 -0.3429045 -1.7573115 -0.69589148
#> Al2O3 0.6587363 -0.6516092 -1.0691711 1.0070705 -1.40860005
#> MgO -0.5349928 2.0542100 0.1946826 0.6532841 -0.17123886
#> K2O 1.8949130 0.2790737 0.5742595 -0.9319702 0.36480160
# inspect singular values of LRA
glass_lra$sv
#> [1] 0.06502356 0.04802956 0.03826908 0.03063650 0.01432346
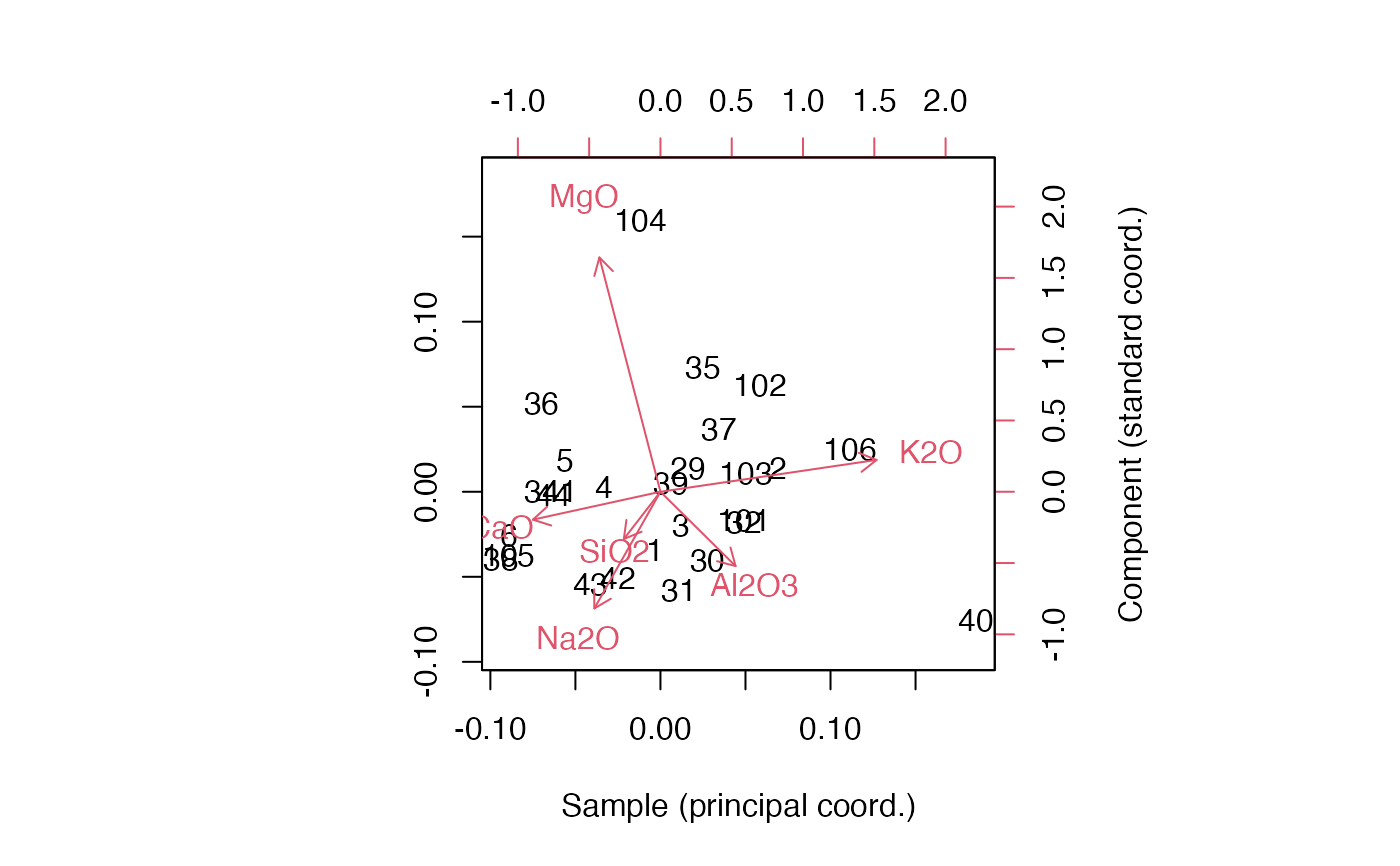
# plot samples and measurements in a biplot
biplot(
x = glass_lra$row.coords %*% diag(glass_lra$sv),
y = glass_lra$column.coords,
xlab = "Sample (principal coord.)", ylab = ""
)
mtext("Component (standard coord.)", side = 4L, line = 3L)