
![]()

This is a ggplot2 extension for alluvial plots.
Design
The alluvial plots implemented here can be used to visualize frequency distributions over time or frequency tables involving several categorical variables. The design is inspired by the alluvial package, but the ggplot2 framework induced several conspicuous differences:
- alluvial understands a variety of inputs (vectors, lists, data frames), whereas ggalluvial requires a single data frame;
- alluvial uses each variable of these inputs as a dimension of the data, whereas ggalluvial requires the user to specify the dimensions, either as separate aesthetics or as key-value pairs;
- alluvial produces both the alluvia, which link cohorts across multiple dimensions, and (what are here called) the strata, which partition the data along each dimension, in a single function; whereas ggalluvial relies on separate layers (stats and geoms) to produce strata, alluvia, and alluvial segments called lodes and flows.
Additionally, ggalluvial arranges these layers vertically without gaps, so that the secondary plotting axis indicates the cumulative values of the strata at each dimension.
Installation
The latest stable release can be installed from CRAN:
install.packages("ggalluvial")The cran branch will contain the version most recently submitted to CRAN. It is duplicated in the master branch, from which source the website is built.
The development version can be installed from the (default) main branch on GitHub:
remotes::install_github("corybrunson/ggalluvial@main", build_vignettes = TRUE)Note that, in order to build the vignettes, the imported packages alluvial, ggfittext, and ggrepel must be installed. To skip this step, leave build_vignettes unspecified or set it to FALSE.
The optimization branch contains a development version with experimental functions to reduce the number or area of alluvial overlaps (see issue #6). Install it as follows:
remotes::install_github("corybrunson/ggalluvial", ref = "optimization")Note, however, that this branch has not kept pace with the main branch or with recent upgrades on CRAN.
Usage
Example
Here is how to generate an alluvial plot representation of the multi-dimensional categorical dataset of passengers on the Titanic:
titanic_wide <- data.frame(Titanic)
head(titanic_wide)
#>   Class    Sex   Age Survived Freq
#> 1   1st   Male Child       No    0
#> 2   2nd   Male Child       No    0
#> 3   3rd   Male Child       No   35
#> 4  Crew   Male Child       No    0
#> 5   1st Female Child       No    0
#> 6   2nd Female Child       No    0
ggplot(data = titanic_wide,
       aes(axis1 = Class, axis2 = Sex, axis3 = Age,
           y = Freq)) +
  scale_x_discrete(limits = c("Class", "Sex", "Age"), expand = c(.2, .05)) +
  xlab("Demographic") +
  geom_alluvium(aes(fill = Survived)) +
  geom_stratum() +
  geom_text(stat = "stratum", aes(label = after_stat(stratum))) +
  theme_minimal() +
  ggtitle("passengers on the maiden voyage of the Titanic",
          "stratified by demographics and survival")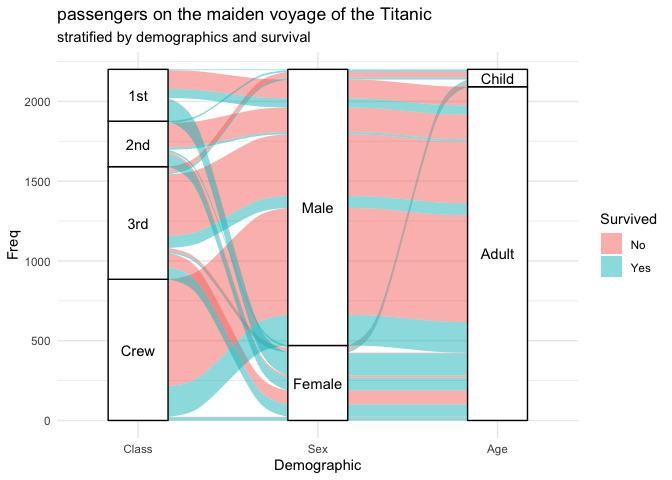
The data is in “wide” format, but ggalluvial also recognizes data in “long” format and can convert between the two:
titanic_long <- to_lodes_form(data.frame(Titanic),
                              key = "Demographic",
                              axes = 1:3)
head(titanic_long)
#>   Survived Freq alluvium Demographic stratum
#> 1       No    0        1       Class     1st
#> 2       No    0        2       Class     2nd
#> 3       No   35        3       Class     3rd
#> 4       No    0        4       Class    Crew
#> 5       No    0        5       Class     1st
#> 6       No    0        6       Class     2nd
ggplot(data = titanic_long,
       aes(x = Demographic, stratum = stratum, alluvium = alluvium,
           y = Freq, label = stratum)) +
  geom_alluvium(aes(fill = Survived)) +
  geom_stratum() + geom_text(stat = "stratum") +
  theme_minimal() +
  ggtitle("passengers on the maiden voyage of the Titanic",
          "stratified by demographics and survival")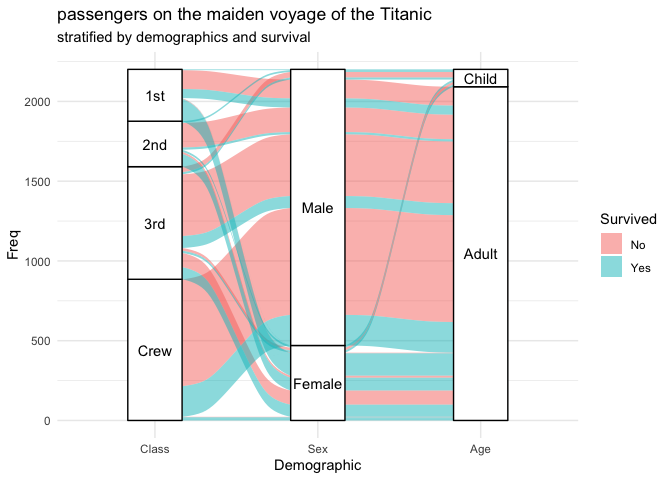
Documentation
For detailed discussion of the data formats recognized by ggalluvial and several examples that illustrate its flexibility and limitations, read the technical vignette:
vignette(topic = "ggalluvial", package = "ggalluvial")Several additional vignettes offer detailed solutions to specific needs:
- “Labeling small strata” (
"labels") for how to elegantly label strata of a wide range of heights in an alluvial plot; - “The Order of the Rectangles” (
"order-rectangles") for how to control the positioning of strata and lodes in an alluvial plot; and - “Tooltips for ggalluvial plots in Shiny apps” (
"shiny") for how to incorporate alluvial plots into interactive apps.
The object documentation includes several more examples. Use help() to call forth more detail on
- any layer (
stat_*orgeom_*), - the conversion functions (
to_*_form), and - the data sets installed with the package (
vaccinationsandmajors).
Short form
For some more digestible guidance on using ggalluvial, check out three cheat sheets and demos by students in Joyce Robbins’s Exploratory Data Analysis and Visualization Community Contribution Project:
- an introduction by Meggie Wen (Chapter 33)
- a cheat sheet by Qingyi Zhang (Chapter 14)
- a blog about how this package implements alluvial plots by Arnav Saxena (Chapter 134)
Acknowledgments
Resources
Development of this package benefitted from the use of equipment and the support of colleagues at UConn Health and at UF Health.
Contribute
Contributions in any form are more than welcome! Pretty much every fix and feature of this package derives from a problem or question posed by someone with datasets or design goals i hadn’t anticipated. See the CONTRIBUTING file for guidance, and please respect the Code of Conduct.