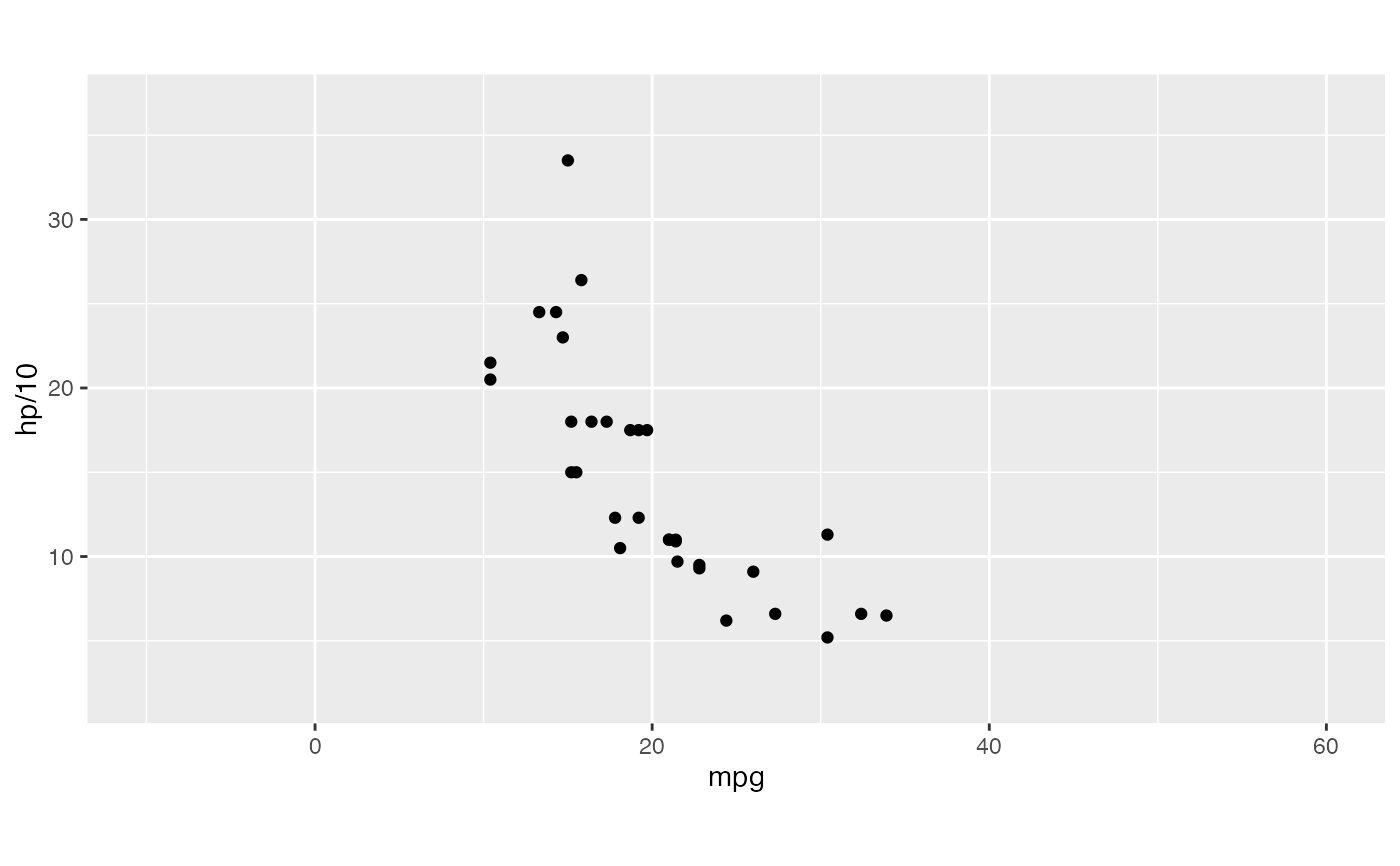
Cartesian coordinates and plotting window with fixed aspect ratios
Source:R/coord-rect.r
coord_rect.RdThe coordinate system CoordRect, alias CoordSquare, provides
control of both coordinate and window aspect ratios and synchronizes tick
marks and grid lines between the axes.
Usage
coord_rect(
  ratio = 1,
  window_ratio = ratio,
  xlim = NULL,
  ylim = NULL,
  expand = TRUE,
  clip = "on",
  sync_breaks = (ratio == 1)
)
Arguments
- ratio
aspect ratio, expressed as
y / x. Can beNULL(default) to not use an aspect ratio. Using1ensures that one unit on the x-axis is the same length as one unit on the y-axis. Ratios higher than one make units on the y-axis longer than units on the x-axis, and vice versa.- window_ratio
Numeric; aspect ratio of plotting window.
- xlim, ylim
Limits for the x and y axes.
- expand
If
TRUE, the default, adds a small expansion factor to the limits to ensure that data and axes don't overlap. IfFALSE, limits are taken exactly from the data orxlim/ylim. Giving a logical vector will separately control the expansion for the four directions (top, left, bottom and right). Theexpandargument will be recycled to length 4 if necessary. Alternatively, can be a named logical vector to control a single direction, e.g.expand = c(bottom = FALSE).- clip
Should drawing be clipped to the extent of the plot panel? A setting of
"on"(the default) means yes, and a setting of"off"means no. In most cases, the default of"on"should not be changed, as settingclip = "off"can cause unexpected results. It allows drawing of data points anywhere on the plot, including in the plot margins. If limits are set viaxlimandylimand some data points fall outside those limits, then those data points may show up in places such as the axes, the legend, the plot title, or the plot margins.- sync_breaks
Logical; if
TRUE, break positions on both axes are computed from a common step size, resulting in a regular lattice. Defaulted to whenratio == 1.
Value
A Coord ggproto object.
Details
Geometric data analysis often requires that coordinates lie on the same scale. Plots of geometric data on a unit aspect ratio may benefit from visual cues to this property, including a fully square plot window and commensurate axis scales.
The window_ratio argument controls the aspect ratio of the plot window
and defaults to 1. The sync_breaks argument controls whether break
positions, which apply to tick marks and grid lines, are synchronized
between the axes. It computes breaks based on the geometric mean of the
axis lengths.
Examples
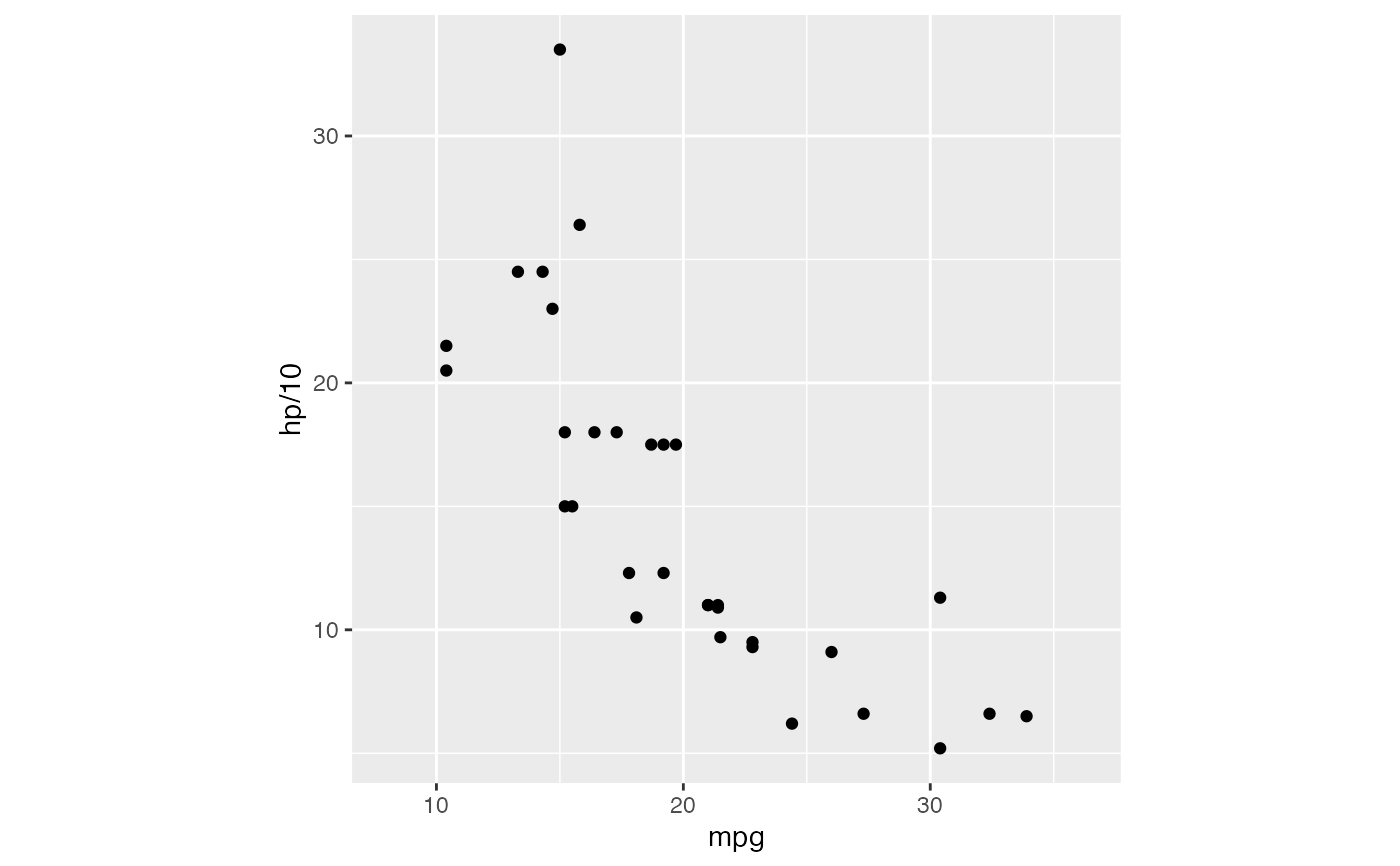
# ensures that the resolutions of the axes and the dimensions of the plotting
# window respect the specified aspect ratios
p <- ggplot(mtcars, aes(mpg, hp/10)) + geom_point()
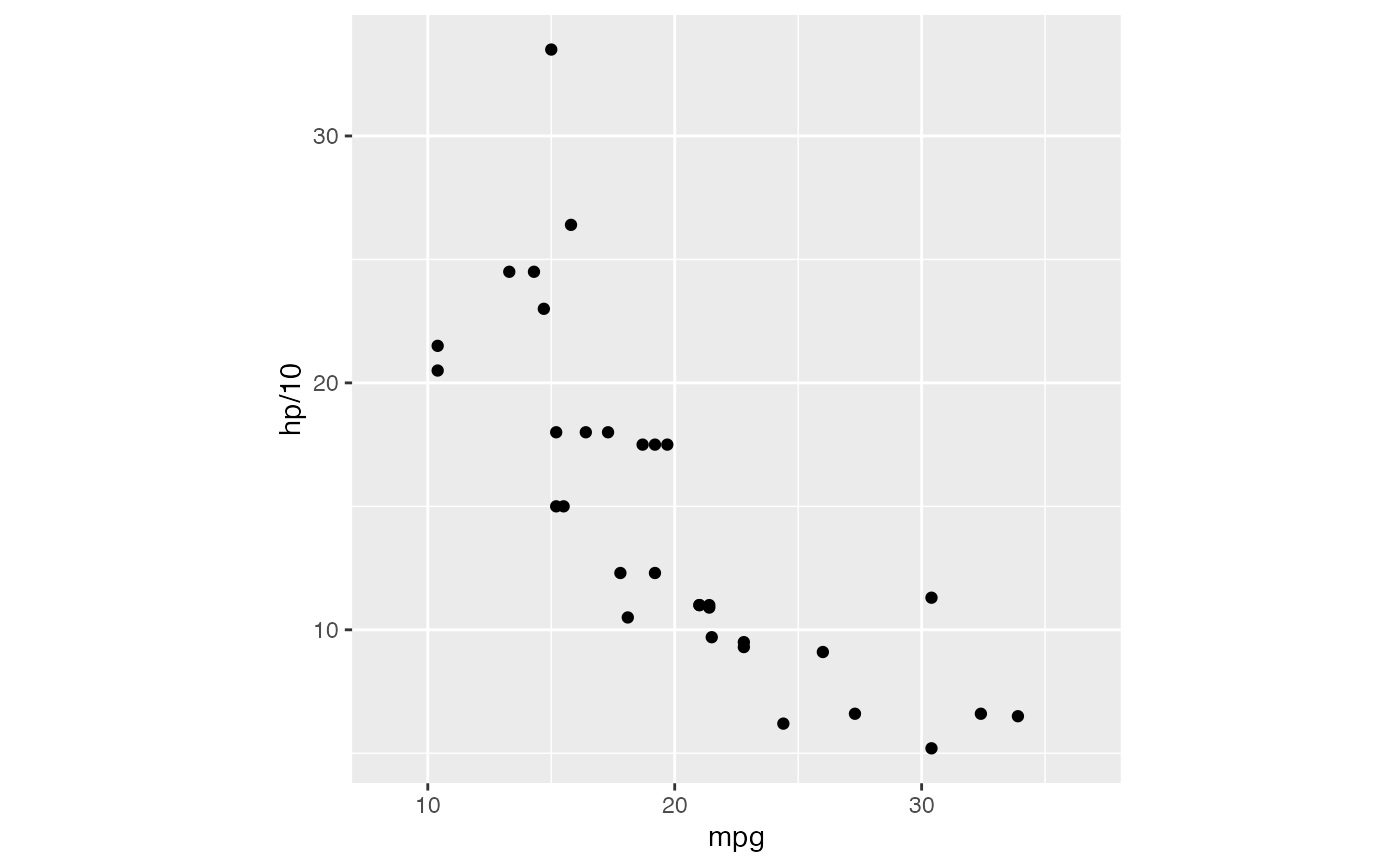
p + coord_rect(ratio = 1)
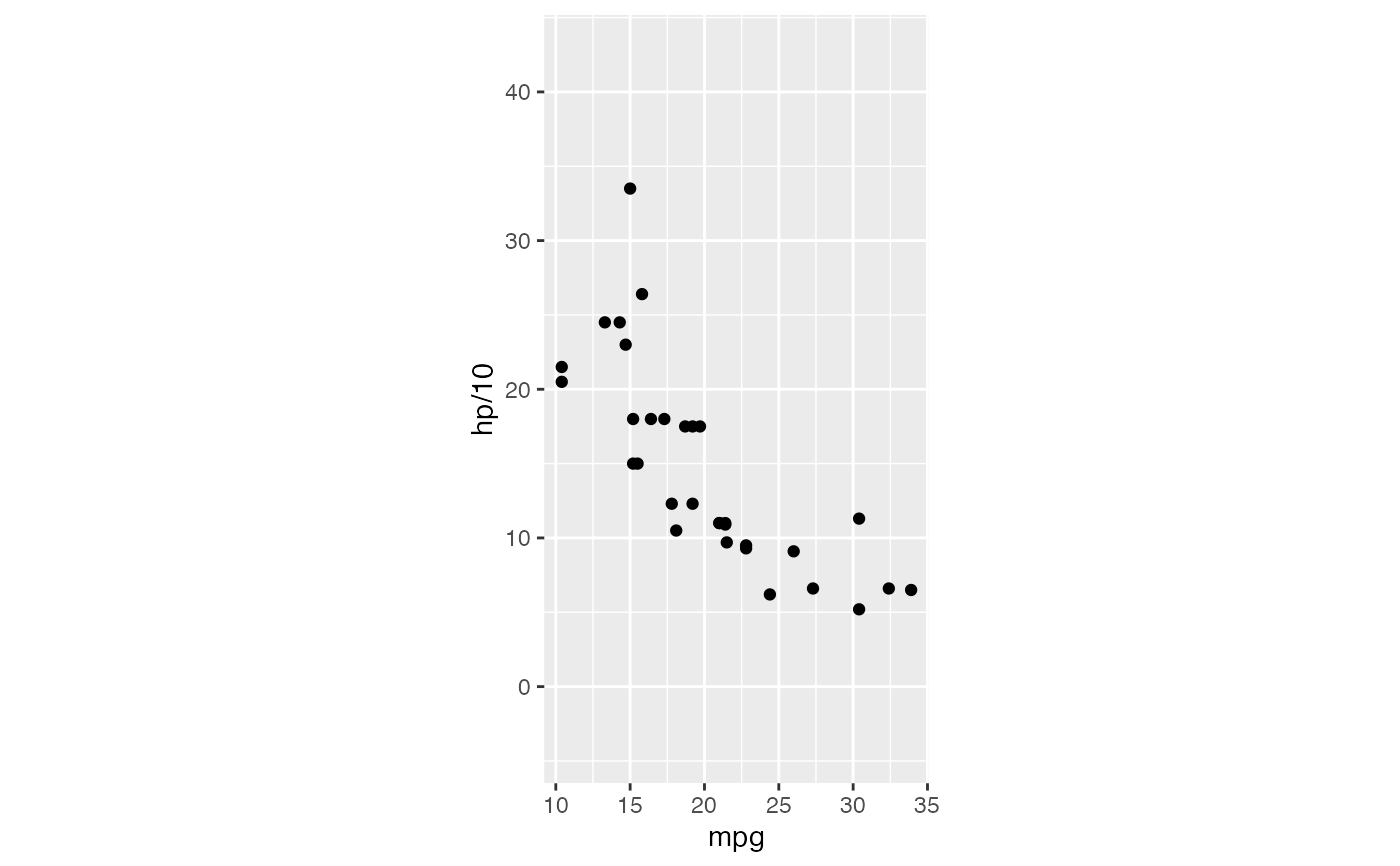
 p + coord_rect(ratio = 1, window_ratio = 2)
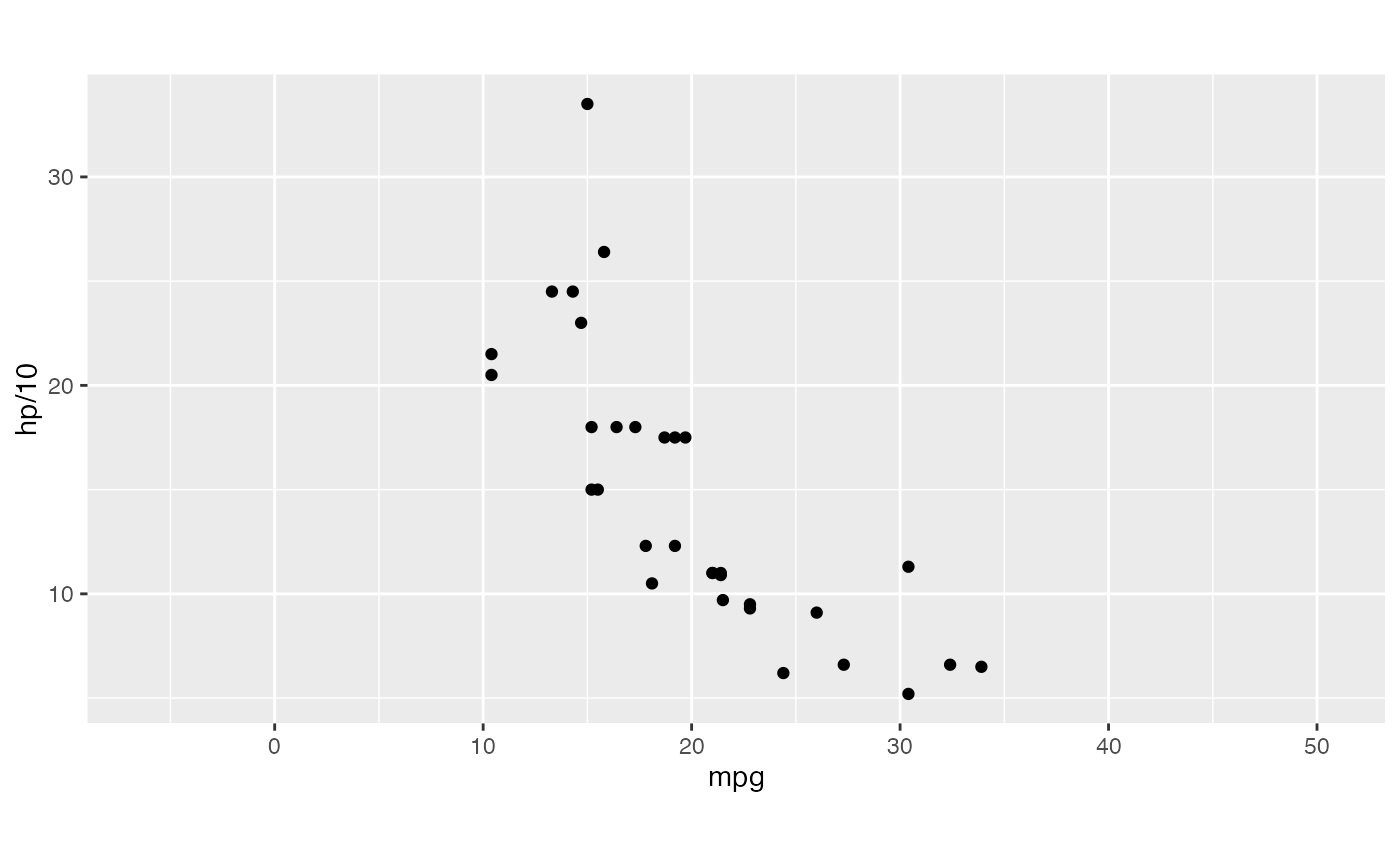
 p + coord_rect(ratio = 1, window_ratio = 1/2)
 # offset squares
p + coord_rect(xlim = c(15, 30))
# offset squares
p + coord_rect(xlim = c(15, 30))
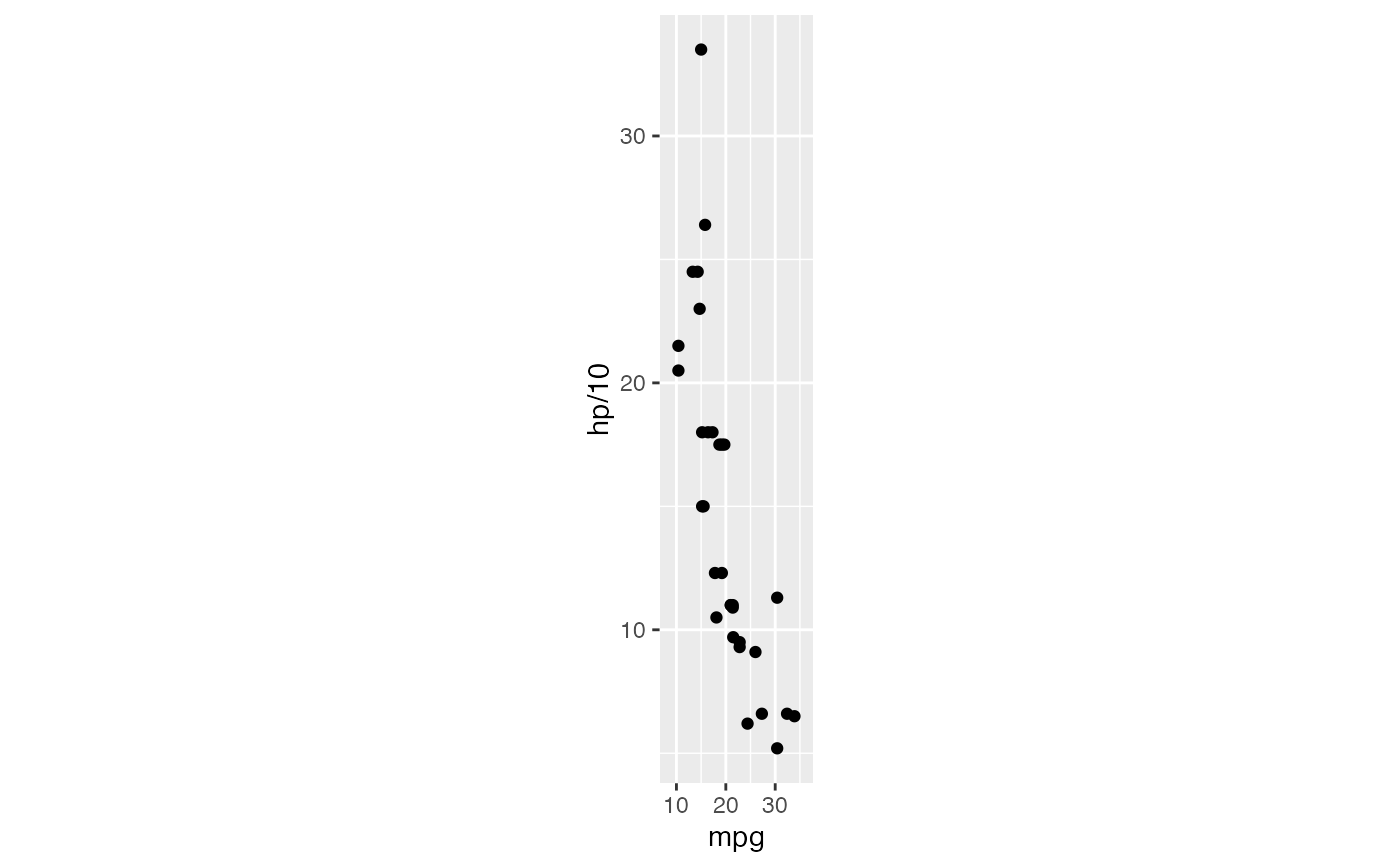 p + coord_rect(ylim = c(15, 30))
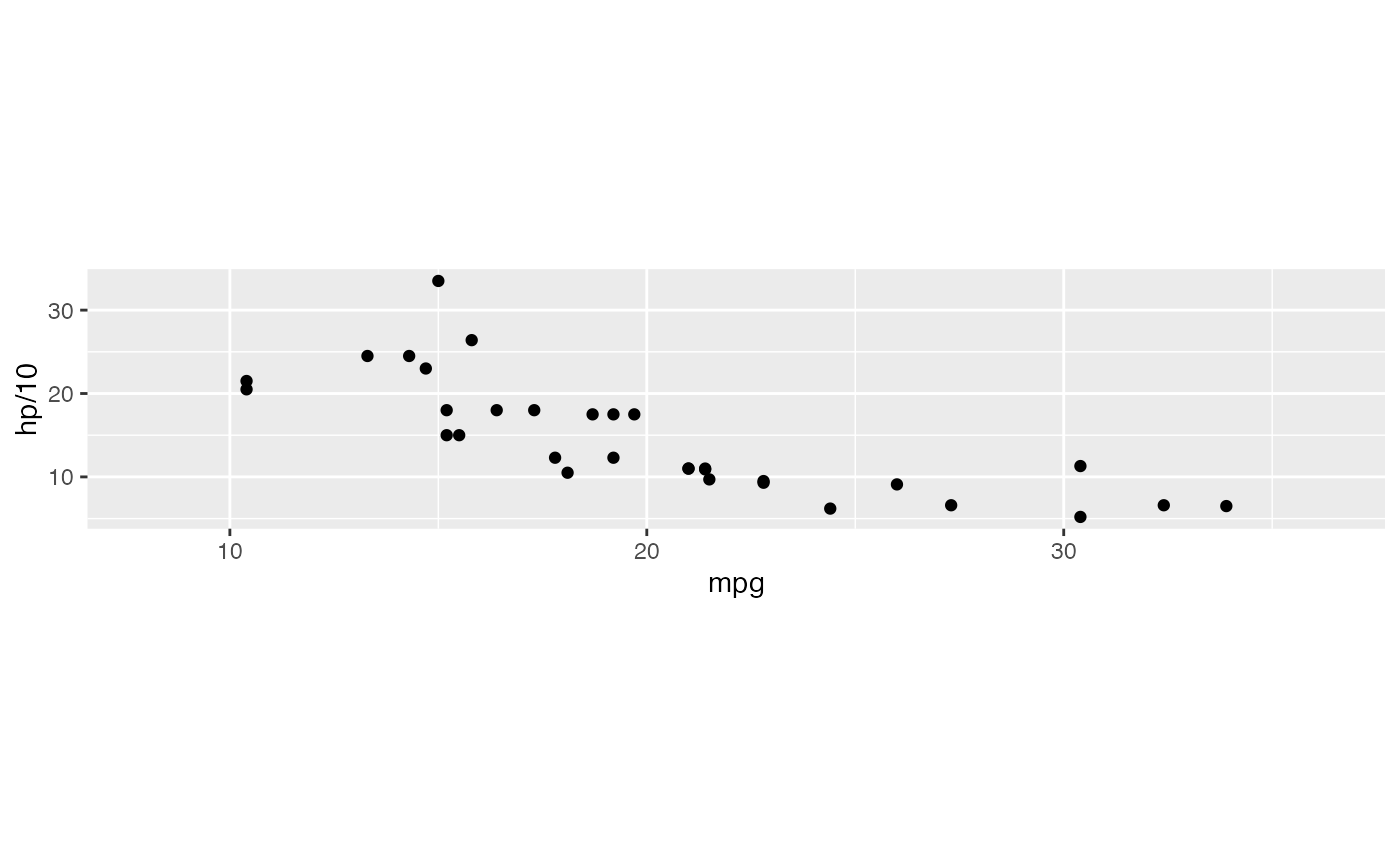 # infeasible to synchronize breaks
p + coord_rect(ratio = 5)
# infeasible to synchronize breaks
p + coord_rect(ratio = 5)
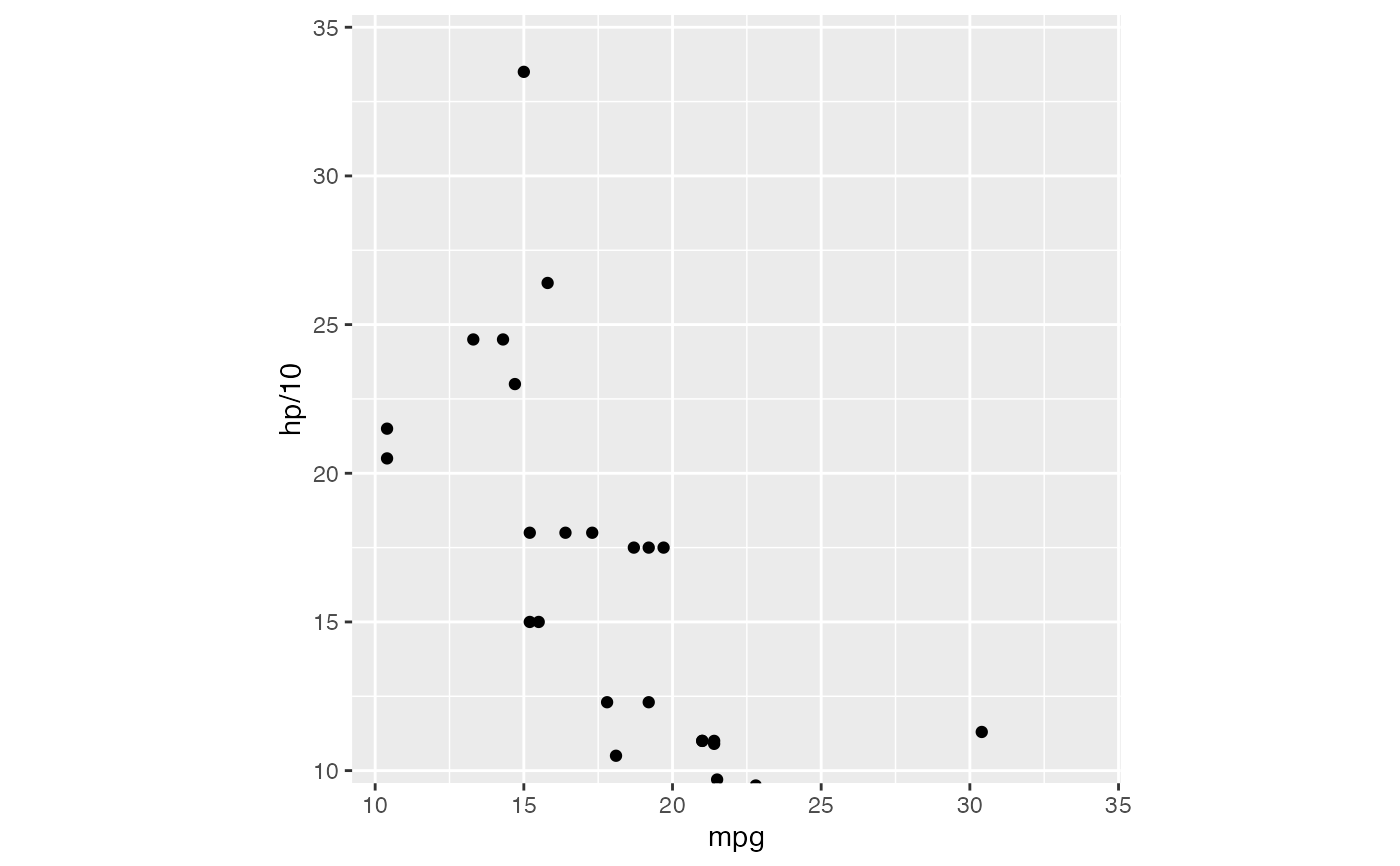
 p + coord_rect(ratio = 1/5)
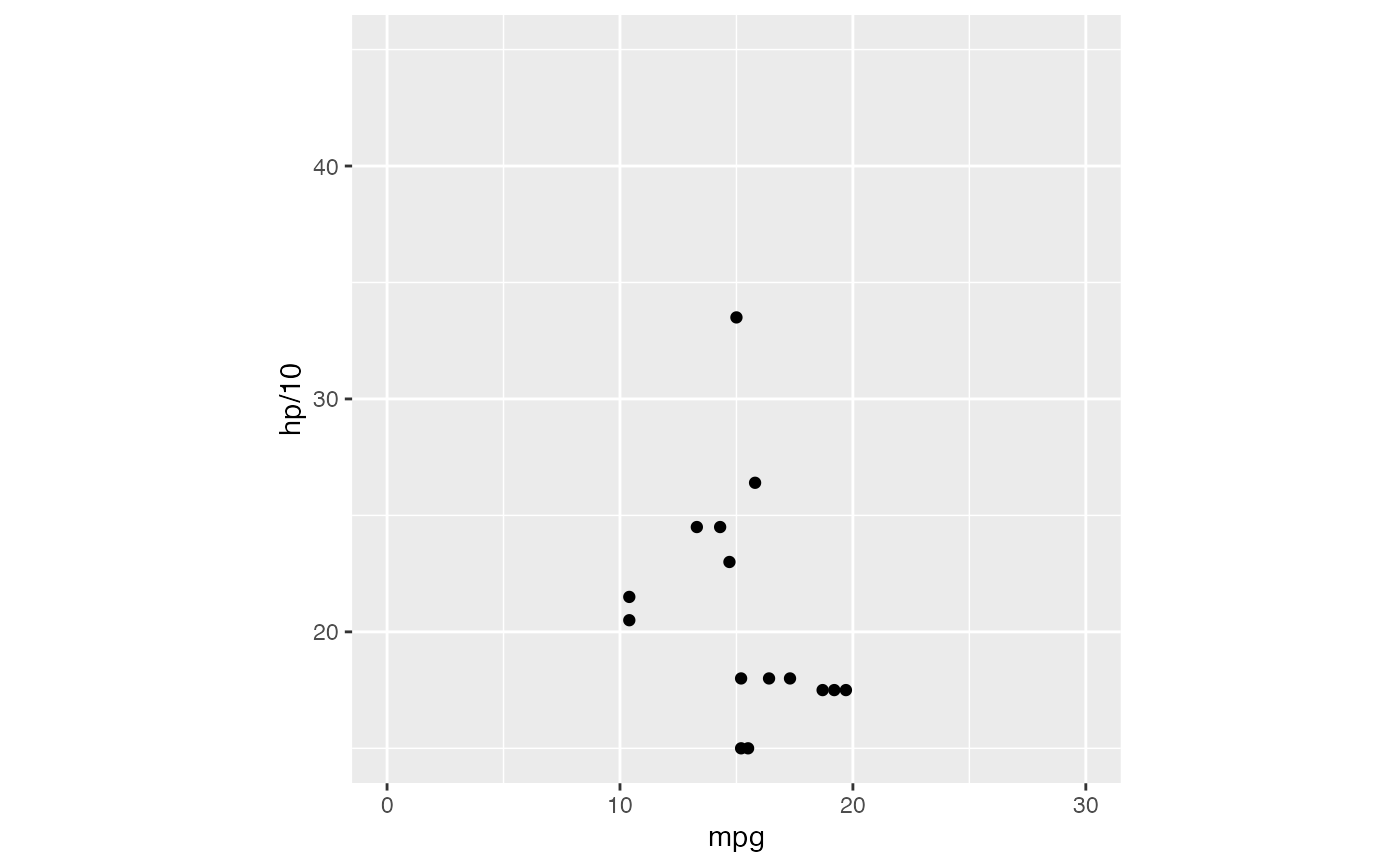
 # force square (even excluding some geometric constructions)
p + coord_square(xlim = c(0, 30), ylim = c(20, 40))
# force square (even excluding some geometric constructions)
p + coord_square(xlim = c(0, 30), ylim = c(20, 40))
 # disable break synchronization
p +
scale_x_continuous(limits = c(-10, 60)) +
coord_rect(ratio = 1, window_ratio = 1/2)
# disable break synchronization
p +
scale_x_continuous(limits = c(-10, 60)) +
coord_rect(ratio = 1, window_ratio = 1/2)
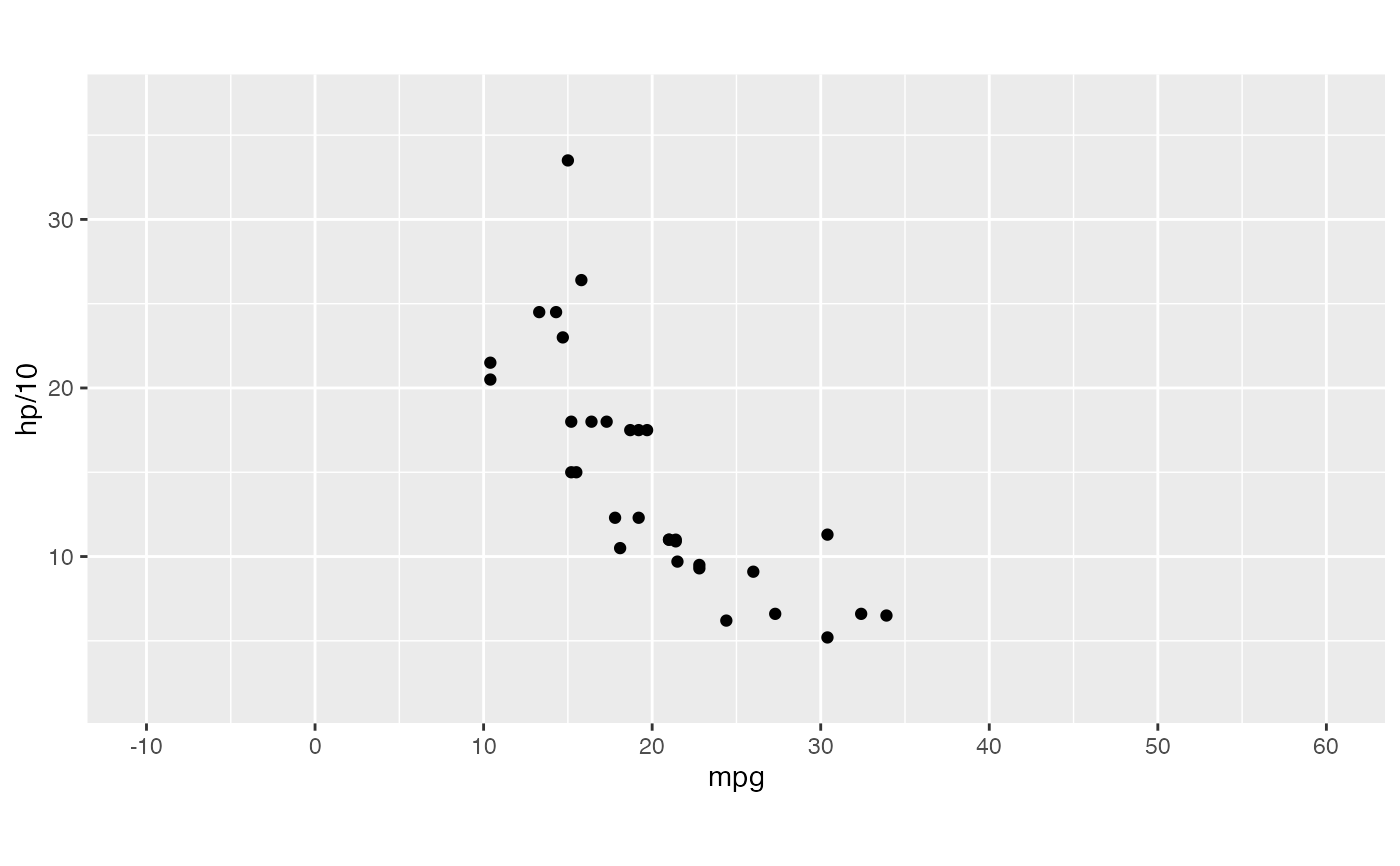 p +
scale_x_continuous(limits = c(-10, 60)) +
coord_rect(ratio = 1, window_ratio = 1/2, sync_breaks = FALSE)
p +
scale_x_continuous(limits = c(-10, 60)) +
coord_rect(ratio = 1, window_ratio = 1/2, sync_breaks = FALSE)